实证资产定价(Empirical asset pricing)已经发布于Github和Pypi. 包的具体用法(Documentation)博主将会陆续在CSDN中详细介绍,也可以通过Pypi直接查看。
Pypi: pip install --upgrade EAP
HomePage: EAP · a catchy description for your project
Github: GitHub - whyecofiliter/EAP: empirical asset pricing
————————————————
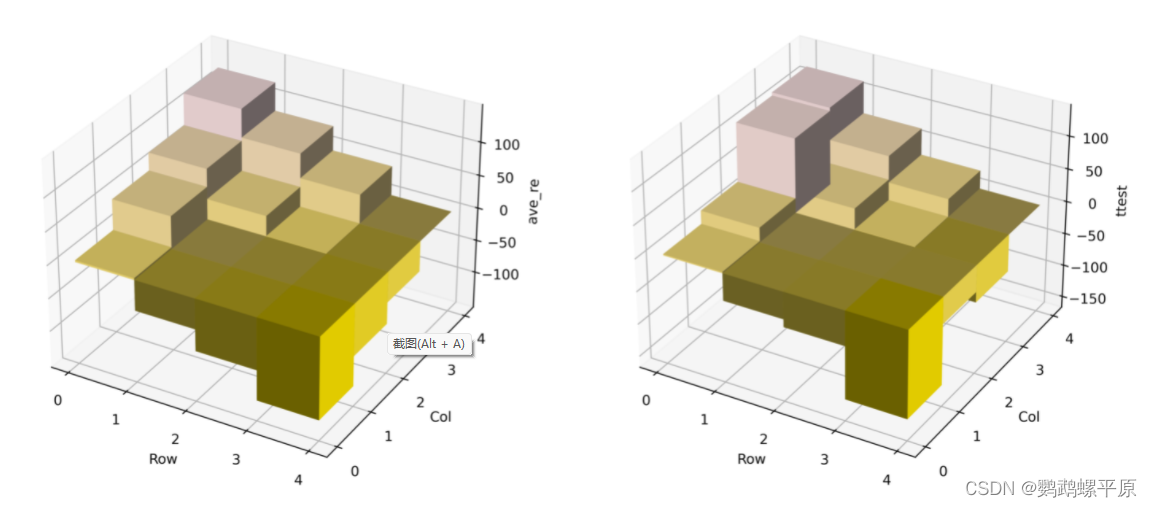
投资组合的结果的表现方式有很多,主要的方式包含数字和图片。图片相对于数字更加直观,更容易发现规律,也更容易呈现。所以,我们添加了对投资组合的图片表现形式。
利用
from EAP.util import plot导入plot函数,该函数的参数为
def plot(portfolio, pattern='scatter', alpha=False, percentage=True, figsize=(14, 7), pos=0.0, **kwargs):
input :
portfolio (ptf_analysis): The fitted portfolio.
pattern (str): The plot patterns, including 'scatter', 'line', and 'bar' for univariate analysis, and including '3d' and 'scatter' for bivariate analysis.
alpha (boolean): Whether plot the factor adjusted alpha. The DEFAULT is False.
percentage (boolean): Whether plot the return and alpha in percentage. The DEFAULT is True.
figsize (tuple): Set the figure size. The DEFAULT is (14, 7).
pos (str): Adjust the position of the axes in 3d figure of bivariate analysis.
kwargs: The keywords of plot in seaborn and matplotlib.
其中
portfolio是拟合后的投资组合。
pattern是图片式样。
alpha是是否包含alpha值。
percentage是是否用百分数来表示组合收益和alpha值。
figsize是图片大小。
pos是调整双重排序的3d图位置
kwargs是seaborn和matplotlib的plot函数中的其他参数。
举例
from EAP.util import plot
from EAP.portfolio_analysis import univariate, bivariateuni = univariate(sample).fit()
plot(uni)bi = bivariate(sample).fit()
plot(bi)
Univariate

Bivariate: 3d
![38 字典名[键名]=值 向字典增加键值对](https://img-blog.csdnimg.cn/dc1838d0e66445dcadb76ae00b07f3bd.png#pic_center)