之前使用ftrace的时候需要一系列的配置,使用起来有点繁琐,这里推荐一个ftrace的一个前端工具,它就是trace-cmd
trace-cmd安装教程
安装trace-cmd及其依赖库
git clone https://git.kernel.org/pub/scm/libs/libtrace/libtraceevent.git/
cd libtraceevent
make
sudo make installgit clone https://git.kernel.org/pub/scm/libs/libtrace/libtracefs.git/
cd libtracefs
make
sudo make installgit clone https://git.kernel.org/pub/scm/linux/kernel/git/rostedt/trace-cmd.git
make
make libs
sudo make install
sudo make install_libs
安装 kernelshark 依赖
sudo apt-get install build-essential git cmake libjson-c-dev -y
sudo apt-get install freeglut3-dev libxmu-dev libxi-dev -y
sudo apt-get install flex bison -y
sudo apt-get install fonts-freefont-ttf -y
sudo apt-get install qtbase5-dev -y
下载kernelshark并安装
git clone git://git.kernel.org/pub/scm/utils/trace-cmd/kernel-shark.git
cd kernel-shark/build
cmake ../
make
sudo ./install_gui.sh
注意:禁止使用
sudo apt-get install kernelshark安装!cmake 版本必须在3.12以上。cmake版本更新方法参考:https://blog.csdn.net/qq_27350133/article/details/121994229
trace-cmd使用方法
可以使用trace-cmd -h 看下支持那些命令。
trace-cmd COMMAND清单
trace-cmd version 3.1.6 ()usage:trace-cmd [COMMAND] ...commands:record - record a trace into a trace.dat fileset - set a ftrace configuration parameterstart - start tracing without recording into a fileextract - extract a trace from the kernelstop - stop the kernel from recording trace datarestart - restart the kernel trace data recordingshow - show the contents of the kernel tracing bufferreset - disable all kernel tracing and clear the trace buffersclear - clear the trace buffersreport - read out the trace stored in a trace.dat filestream - Start tracing and read the output directlyprofile - Start profiling and read the output directlyhist - show a histogram of the trace.dat informationstat - show the status of the running tracing (ftrace) systemsplit - parse a trace.dat file into smaller file(s)options - list the plugin options available for trace-cmd reportlisten - listen on a network socket for trace clientsagent - listen on a vsocket for trace clientssetup-guest - create FIFOs for tracing guest VMslist - list the available events, plugins or optionsrestore - restore a crashed recordsnapshot - take snapshot of running tracestack - output, enable or disable kernel stack tracingcheck-events - parse trace event formatsdump - read out the meta data from a trace fileconvert - convert trace file to different version
record
记录trace信息到trace.dat 。
trace-cmd record ['OPTIONS'] ['command']
跟踪ls进程函数调用过程
# trace-cmd record -p function -e sched_switch ls > /dev/null# trace-cmd reportls-13587 [002] 106467.860310: function: hrtick_start_fair <-- pick_next_task_fairls-13587 [002] 106467.860313: sched_switch: prev_comm=trace-cmd prev_pid=13587 prev_prio=120 prev_state=R ==> next_comm=trace-cmd next_pid=13583 next_prio=120trace-cmd-13585 [001] 106467.860314: function: native_set_pte_at <-- __do_faulttrace-cmd-13586 [003] 106467.860314: function: up_read <-- do_page_faultls-13587 [002] 106467.860317: function: __phys_addr <-- scheduletrace-cmd-13585 [001] 106467.860318: function: _raw_spin_unlock <-- __do_faultls-13587 [002] 106467.860320: function: native_load_sp0 <-- __switch_totrace-cmd-13586 [003] 106467.860322: function: down_read_trylock <-- do_page_fault
使用function_graph跟踪irq_handler_entry跟踪点的do_IRQ函数。
# trace-cmd record -p function_graph -e irq_handler_entry -l do_IRQ sleep 10# trace-cmd report<idle>-0 [000] 157412.933969: funcgraph_entry: | do_IRQ() {<idle>-0 [000] 157412.933974: irq_handler_entry: irq=48 name=eth0<idle>-0 [000] 157412.934004: funcgraph_exit: + 36.358 us | }<idle>-0 [000] 157413.895004: funcgraph_entry: | do_IRQ() {<idle>-0 [000] 157413.895011: irq_handler_entry: irq=48 name=eth0<idle>-0 [000] 157413.895026: funcgraph_exit: + 24.014 us | }<idle>-0 [000] 157415.891762: funcgraph_entry: | do_IRQ() {<idle>-0 [000] 157415.891769: irq_handler_entry: irq=48 name=eth0<idle>-0 [000] 157415.891784: funcgraph_exit: + 22.928 us | }<idle>-0 [000] 157415.934869: funcgraph_entry: | do_IRQ() {<idle>-0 [000] 157415.934874: irq_handler_entry: irq=48 name=eth0<idle>-0 [000] 157415.934906: funcgraph_exit: + 37.512 us | }<idle>-0 [000] 157417.888373: funcgraph_entry: | do_IRQ() {<idle>-0 [000] 157417.888381: irq_handler_entry: irq=48 name=eth0<idle>-0 [000] 157417.888398: funcgraph_exit: + 25.943 us | }
OPTIONS 和 command 可以使用 trace-cmd record --h列出。
set
设置ftrace参数配置。
trace-cmd set ['OPTIONS'] ['command']
使能所有的跟踪事件
trace-cmd set -e all
设置function tracer
trace-cmd set -p function
start
开始跟踪,但并不记录信息到文件。
trace-cmd start ['OPTIONS']
extract
从tracer中提取跟踪信息,一般用在start 和stop之后。也可以将跟踪信息从ring buffer 提取到trace.dat。
trace-cmd extract ['OPTIONS']
stop
停止向ring buffer写入跟踪信息。
restart
重新开始记录跟踪信息
show
显示tracing buffer中的信息(trace, snapshot, trace_pipe)。类似于 cat /sys/kernel/debug/tracing/trace。
trace-cmd show ['OPTIONS']
reset
对ftrace的设置和ring buffer复位。
trace-cmd reset ['OPTIONS']
设置每个cpu的buffer大小为1024
trace-cmd reset -b 1024
删除实例buffer,并重置顶层实例,
trace-cmd reset -t -a -d
clear
清空ring buffer。
trace-cmd clear ['OPTIONS']
清空所有buffer,包括top level
trace-cmd clear -a
清空指定buffer
trace-cmd clear -B buffer-name
report
读取trace的信息,并存储在trace.dat。
trace-cmd report ['OPTIONS'] ['input-file']
# trace-cmd reporttrace-cmd-16129 [002] 158126.498411: function: __mutex_unlock_slowpath <-- mutex_unlocktrace-cmd-16131 [000] 158126.498411: kmem_cache_alloc: call_site=811223c5 ptr=0xffff88003ecf2b40 bytes_req=272 bytes_alloc=320 gfp_flags=GFP_KERNEL|GFP_ZEROtrace-cmd-16130 [003] 158126.498411: function: do_splice_to <-- sys_splicesleep-16133 [001] 158126.498412: function: inotify_inode_queue_event <-- vfs_writetrace-cmd-16129 [002] 158126.498420: lock_release: 0xffff88003f1fa4f8 &sb->s_type->i_mutex_keytrace-cmd-16131 [000] 158126.498421: function: security_file_alloc <-- get_empty_filpsleep-16133 [001] 158126.498422: function: __fsnotify_parent <-- vfs_writetrace-cmd-16130 [003] 158126.498422: function: rw_verify_area <-- do_splice_totrace-cmd-16131 [000] 158126.498424: function: cap_file_alloc_security <-- security_file_alloctrace-cmd-16129 [002] 158126.498425: function: syscall_trace_leave <-- int_check_syscall_exit_worksleep-16133 [001] 158126.498426: function: inotify_dentry_parent_queue_event <-- vfs_writetrace-cmd-16130 [003] 158126.498426: function: security_file_permission <-- rw_verify_areatrace-cmd-16129 [002] 158126.498428: function: audit_syscall_exit <-- syscall_trace_leave
记录除function traces 之外的所有跟踪信息
# trace-cmd report -v -F 'function'trace-cmd-16131 [000] 158126.498411: kmem_cache_alloc: call_site=811223c5 ptr=0xffff88003ecf2b40 bytes_req=272 bytes_alloc=320 gfp_flags=GFP_KERNEL|GFP_ZEROtrace-cmd-16129 [002] 158126.498420: lock_release: 0xffff88003f1fa4f8 &sb->s_type->i_mutex_keytrace-cmd-16130 [003] 158126.498436: lock_acquire: 0xffffffff8166bf78 read all_cpu_access_locktrace-cmd-16131 [000] 158126.498438: lock_acquire: 0xffff88003df5b520 read &fs->locktrace-cmd-16129 [002] 158126.498446: kfree: call_site=810a7abb ptr=0x0trace-cmd-16130 [003] 158126.498448: lock_acquire: 0xffff880002250a80 &per_cpu(cpu_access_lock, cpu)trace-cmd-16129 [002] 158126.498450: sys_exit_splice: 0xfffffff5trace-cmd-16131 [000] 158126.498454: lock_release: 0xffff88003df5b520 &fs->locksleep-16133 [001] 158126.498456: kfree: call_site=810a7abb ptr=0x0sleep-16133 [001] 158126.498460: sys_exit_write: 0x1trace-cmd-16130 [003] 158126.498462: kmalloc: call_site=810bf95b ptr=0xffff88003dedc040 bytes_req=24 bytes_alloc=32 gfp_flags=GFP_KERNEL|GFP_ZERO
只记录kmalloc系统调用中大于1000 bytes 的信息
#trace-cmd report -F 'kmalloc: bytes_req > 1000'<idle>-0 [000] 158128.126641: kmalloc: call_site=81330635 ptr=0xffff88003c2fd000 bytes_req=2096 bytes_alloc=4096 gfp_flags=GFP_ATOMIC
stream
实时在shell中显式ftrace结果。
trace-cmd stream ['OPTIONS'] ['command']
profile
类似于trace-cmd record - profile命令,但profile不会将跟踪内容写入文件,可以节省磁盘空间,适用于长时间跟踪。
trace-cmd profile ['OPTIONS'] ['command']
hist
对trace.dat显式统计信息。
trace-cmd hist ['OPTIONS']['input-file']
stat
显示当前ftrace的events、ring buffer等情况。
*Instances:* List all configured ftrace instances.*Tracer:* if one of the tracers (like function_graph) is active. Otherwisenothing is displayed.*Events:* Lists the events that are enable.*Event filters:* Shows any filters that are set for any events*Function filters:* Shows any filters for the function tracers*Graph functions:* Shows any functions that the function graph tracer should graph*Buffers:* Shows the trace buffer size if they have been expanded.By default, tracing buffers are in a compressed format until they are used.If they are compressed, the buffer display will not be shown.*Trace clock:* If the tracing clock is anything other than the default "local"it will be displayed.*Trace CPU mask:* If not all available CPUs are in the tracing CPU mask, thenthe tracing CPU mask will be displayed.*Trace max latency:* Shows the value of the trace max latency if it is other than zero.*Kprobes:* Shows any kprobes that are defined for tracing.*Uprobes:* Shows any uprobes that are defined for tracing.*Error log:* Dump the content of ftrace error_log file.
trace-cmd stat ['OPTIONS']
split
以start-time和end-time将trace.dat分为更小的文件。
trace-cmd split ['OPTIONS'] ['start-time' ['end-time']]
options
列出trace-cmd可用的插件。

listen
设置一个端口等待远程连接。连接上后,如果远程主机发来信息,则创建一个trace.HOST:PORT.dat文件记录信息。
trace-cmd listen -p 'port' ['OPTIONS']
agent
trace-cmd agent通过vsocket或TCP端口侦听连接,以控制对计算机的跟踪。然后,agent将在本地计算机上开始跟踪,并将数据传递给控制连接。
trace-cmd agent ['OPTIONS']
setup-guest
创建用于跟踪虚拟机的fifos
list
显示当前ftrace支持的events、tracers、options。
trace-cmd list ['OPTIONS']
restore
恢复崩溃的trace-cmd-record 文件。
trace-cmd restore ['OPTIONS'] ['command'] cpu-file [cpu-file ...]
snapshot
抓取tracing过程中的快照。
*trace-cmd snapshot* ['OPTIONS']
stack
内核的堆栈跟踪
trace-cmd stack [--start][--stop][--reset]
check-events
解析所有events的格式字符串,有助于检查任何跟踪事件格式字符串
trace-cmd check-events ['OPTIONS']
dump
展示 trace-cmd record记录的元数据
# trace-cmd dump --summary -i trace.datTracing meta data in file trace.dat:[Initial format]6 [Version]0 [Little endian]8 [Bytes in a long]4096 [Page size, bytes][Header info, 205 bytes][Header event, 205 bytes][Ftrace format, 15 events][Events format, 2 systems][Kallsyms, 7144493 bytes][Trace printk, 2131 bytes][Saved command lines, 117 bytes]8 [CPUs with tracing data][12 options][Flyrecord tracing data]
# trace-cmd dump --summary --systems -i trace.datTracing meta data in file trace.dat:[Initial format]6 [Version]0 [Little endian]8 [Bytes in a long]4096 [Page size, bytes][Header info, 205 bytes][Header event, 205 bytes][Ftrace format, 15 events][Events format, 3 systems]sched 23 [system, events]irq 5 [system, events]kvm 70 [system, events][Kallsyms, 7144493 bytes][Trace printk, 2131 bytes][Saved command lines, 157 bytes]8 [CPUs with tracing data][11 options][Flyrecord tracing data]
convert
将trace file转换为不同格式。
trace-cmd convert ['OPTIONS'] ['output-file']
将trace file选择合适的压缩算法,压缩为trace_compress.dat,
trace-cmd convert --compression any trace_compress.dat
更详细的使用方法详见 https://github.com/rostedt/trace-cmd/tree/master/Documentation/trace-cmd
trace-cmd使用举例
function && function_graph跟踪
列出可用的追踪器
root@firefly:~# trace-cmd list -t
blk function_graph wakeup_dl wakeup_rt wakeup irqsoff function nop
查看可被追踪的函数
root@firefly:~# trace-cmd list -f | grep do_sys_open
do_sys_open
调整函数调用中追踪深度:
root@firefly:~# trace-cmd start -p function_graph --max-graph-depth 5
启用function跟踪并查看输出
root@firefly:~# trace-cmd start -p functionplugin 'function'
root@firefly:~# trace-cmd show | head -20
# tracer: function
#
# entries-in-buffer/entries-written: 231316/448381   #P:6
#
#                              _-----=> irq                        / _----=       | / _---=> hardirq/softir    || / _--=> preempt-depth
#            ||| /     delay
#      TIMESTAMP  FUNCTION
#       |       |   ||||       |         |<idle>-0     [005]607.424217: hrtimer_start_range_ick_nohz_restart<idl-0     [005] dn..   607.424218: rtimer_base.isra.1 <-hrtimer_start_range_ns<idle>-0 [005] dn..   607.424219: _raw_spck_irqsave <-lock_hrtimer_base.ia.1<idle>-0     [005n..   607.424219: do_raw_spin_lock <-_raw_spin_lock_irqsave<idle>-0     [005] dn..   607.424220: ktime_add_safe <-hrtimer_start_range_ns<idle>-0     [005] dn..   607.424222: enqueue_hrtimer <-hrtimer_start_range_ns<idle>-0     [005] dn..   607.424223: tick_program_event <-hrtimer_start_range_ns<idle>-0     [005] dn..   607.424224: clockevents_program_event <-tick_program_event<idle>-0     [005] dn..   607.424224: ktime_get <-clockevents_program_event
root@firefly:~#
停止跟踪并清空缓冲区
trace-cmd stop
trace-cmd clear
追踪特定函数
root@firefly:~# trace-cmd start  -p function -l do_sys_openplugin 'function'
root@firefly:~# trace-cmd show | head -20
# tracer: function
#
# entries-in-buffer/entries-written: 49/49   #P:6
#
#                  off
#                                                  | / _---                   || / _--=> preempt-depth
#                            ||| /     delay
#           TASK-PID   CPU#  ||||    IMESTAMP  FUNCTION
#              | |       |   ||||       |         |lxqt-panel-1100  [002] ....  1342.237668: do_sys_open <-SyS_openatsystemd-1     [000] ....  1343.172830: do_sys_open <-SyS_openatsd-resolve-683   [002] ....  1343.173117: do_sys_open <-SyS_openatlxqt-panel-1100  [002] ....  1343.237235: do_sys_open <-SyS_openatlxqt-panel-1100  [002] ....  1344.237580: do_sys_open <-SyS_openatlxqt-panel-1100  [002] ....  1345.237314: do_sys_open <-SyS_openatlxqt-panel-1100  [002] ....  1346.237657: do_sys_open <-SyS_openatlxqt-panel-1100  [002] ....  1347.237311: do_sys_open <-SyS_openathead-1289  [004] ....  1348.034549: do_sys_open <-SyS_openat
不追踪某个函数
root@firefly:~# trace-cmd start -p function -n do_sys_open
追踪特定PID
trace-cmd record -P 10885 -p function_graph
trace-cmd start 和trace-cmd record参数类似,trace-cmd record 会记录追踪内容到trace.dat。
追踪指定的进程
root@firefly:~# trace-cmd record -p function -F ls
root@firefly:~# trace-cmd report trace.dat | head -20
cpus=6ls-1286  [005]   650.095974: function:             mutex_unlockls-1286  [005]   650.095976 function:                __mutewpathls-1286  [005]   650.095977: function:            _raw_spin_lockls-1286  [005]   650.095977: function:                     n_lockls-1286  [   650.095978: function:                  wake_q_adds-1286  [005]   650.095979: function:                   _raw_spin_unlockls-1286  [005]   650.095979: function:                      do_raw_spin_unlockls-1286  [005]   650.095980: function:                   wake_up_qls-1286  [005]   650.095980: function:                      try_to_wake_upls-1286  [005]   650.095981: function:                         _raw_spin_lock_irqsavels-1286  [005]   650.095981: function:                            do_raw_spin_lockls-1286  [005]   650.095982: function:                         _raw_spin_lockls-1286  [005]   650.095983: function:                            do_raw_spin_lockls-1286  [005]   650.095984: function:                         _raw_spin_unlockls-1286  [005]   650.095984: function:                            do_raw_spin_unlockls-1286  [005]   650.095984: function:                         task_waking_fairls-1286  [005]   650.095985: function:                            record_wakeels-1286  [005]   650.095986: function:                         select_task_rq_fairls-1286  [005]   650.095986: function:                            record_wakee
event跟踪
查看所有这些事件的列表:
cat /sys/kernel/debug/tracing/available_events
事件跟踪模板
trace-cmd record -e 'subsystem:event-name'
追踪sched子系统的sched_switch事件
root@firefly:~# trace-cmd record -e sched:sched_switch
Hit Ctrl^C to stop recording
^C^C^C^C^CCPU0 data recorded at offset=0x117000214 bytes in size (4096 uncompressed)
CPU1 data recoed at offset=0x118000293 bytes in size (4096 uncompressed)rded at offset=0x119000260096 uncompressed)
CPU3 data recorded at offset=0x11a00011 uncompressed)
CPU4 data recordset=0x11b000260 bytes in sncompressed)
CPU5 data recordedffset=0x11c000914 bytes in size (12288 uncompressed)
root@firefly:~# trace-cmd report trace.dat | head -20
cpus=6trace-cmd-1298  [000]   857.010582: sched_switch:         trace-cmd:1298 [120] S 004]   857.010631: sched_switch::1299 [120]<idle>-0 pper/5:0 [120] R ==> trace-cmd:1857.010704: sched_switch:       race-cmd:1304 [120]trac sched_switch:         trace-cmd==> swapper/4:0 [120]tr  [005]   857.010744: sched_switrace-cmd:1304 [120] S ==> swappe0]<idle>-0     [001]        swapper/1:0 [120] R ==>  [120]<idle>-0     [005]   857.011293: sched_switch:         swapper/5:0 [120] R ==> trace-cmd:1300 [120]trace-cmd-1300  [005]   857.011342     trace-cmd:1300 [120] S ==> 120]rcu_sched-7     [00  857.011358: sched_switch:         rcu_sched:7 [120] S ==> swapper/1:0 [120]<idle>-0     [001]   857.014074: sched_switch:         swapper/1:0 [120] R ==> rcu_sched:7 [120]rcu_sched-7     [001]   857.014150: sched_switch:         rcu_sched:7 [120] S ==> swapper/1:0 [120]<idle>-0     [005]   857.014948: sched_switch:         swapper/5:0 [120] R ==> kworker/5:2:136 [120]kworker/5:2-136   [005]   857.014971: sched_switch:         kworker/5:2:136 [120] S ==> swapper/5:0 [120]<idle>-0     [001]   857.017159: sched_switch:         swapper/1:0 [120] R ==> rcu_sched:7 [120]rcu_sched-7     [001]   857.017267: sched_switch:         rcu_sched:7 [120] S ==> swapper/1:0 [120]<idle>-0     [001]   857.020239: sched_switch:         swapper/1:0 [120] R ==> rcu_sched:7 [120]rcu_sched-7     [001]   857.020336: sched_switch:         rcu_sched:7 [120] S ==> swapper/1:0 [120]<idle>-0     [005]   857.058091: sched_switch:         swapper/5:0 [120] R ==> kworker/5:2:136 [120]
只打印下一个进程ID大于800的跟踪结果
root@firefly:~# trace-cmd report -F 'sched_switch: next_pid > 800'
cpus=6trace-cmd-1375  [005]  1891.087860: sched_switch:         trace-cmd:1375 [120] R   1891.087913: sched_switch:    5 [120]trace-cmd-1376           trace-cmd:1376 [120] R idle>-0     [005]  1891.088014: apper/5:0 [120] R ==> trace-cmd:371  [004]  1891.088048: sched_sh:         trace-cmd:1371 [120] 376 [120]<idle>-0   91.090580: sched_switch:        r/4:0 [120] R ==> trace-cmd:1373    <idle>-0     [000]  1891.371      swapper/0:0 [120] R ==> kw1342 [120]<idle>-0  1]  1891.403968: sched_switch:         swapper/1:0 [120] R ==> gvfs-afc-volume:1161 [120]<idle>-0     [000]  1891.586038: sched_switch:         swapper/0:0 [120] R ==> kworker/u12:0:1342 [120]<idle>-0     [001]  1891.586262: sched_switch:         swapper/1:0 [120] R ==> trace-cmd:1370 [120]
事件打印格式可参考format
root@firefly:~# cat /sys/kernel/debug/tracing/events/sched/sched_switch/format
name: sched_switch
ID: 250
format:field:unsigned short common_type;       offset:0;       size:2; signed:0;field:unsigned char common_flags;       offset:2;       size:1; signed:0;field:unsigned char common_preempt_count;       offset:3;       size:1; signed:0;field:int common_pid;   offset:4;       size:4; signed:1;field:char prev_comm[16];       offset:8;       size:16;        signed:0;field:pid_t prev_pid;   offset:24;      size:4; signed:1;field:int prev_prio;    offset:28;      size:4; signed:1;field:long prev_state;  offset:32;      size:8; signed:1;field:char next_comm[16];       offset:40;      size:16;        signed:0;field:pid_t next_pid;   offset:56;      size:4; signed:1;field:int next_prio;    offset:60;      size:4; signed:1;print fmt: "prev_comm=%s prev_pid=%d prev_prio=%d prev_state=%s%s ==> next_comm=%s next_pid=%d next_prio=%d", REC->prev_comm, REC->prev_pid, REC->prev_prio, REC->prev_state & (4096-1) ? __print_flags(REC->prev_state & (4096-1), "|", { 1, "S"} , { 2, "D" }, { 4, "T" }, { 8, "t" }, { 16, "Z" }, { 32, "X" }, { 64, "x" }, { 128, "K" }, { 256, "W" }, { 512, "P" }, { 1024, "N" }) : "R", REC->prev_state & 4096 ? "+" : "", REC->next_comm, REC->next_pid, REC->next_prio
kernelshark的使用
kernelshark记录事件
通过在命令行输出kernelshark可以启动kernelshark。通过菜单栏执行Tools->Record,会弹出Capture对话框。
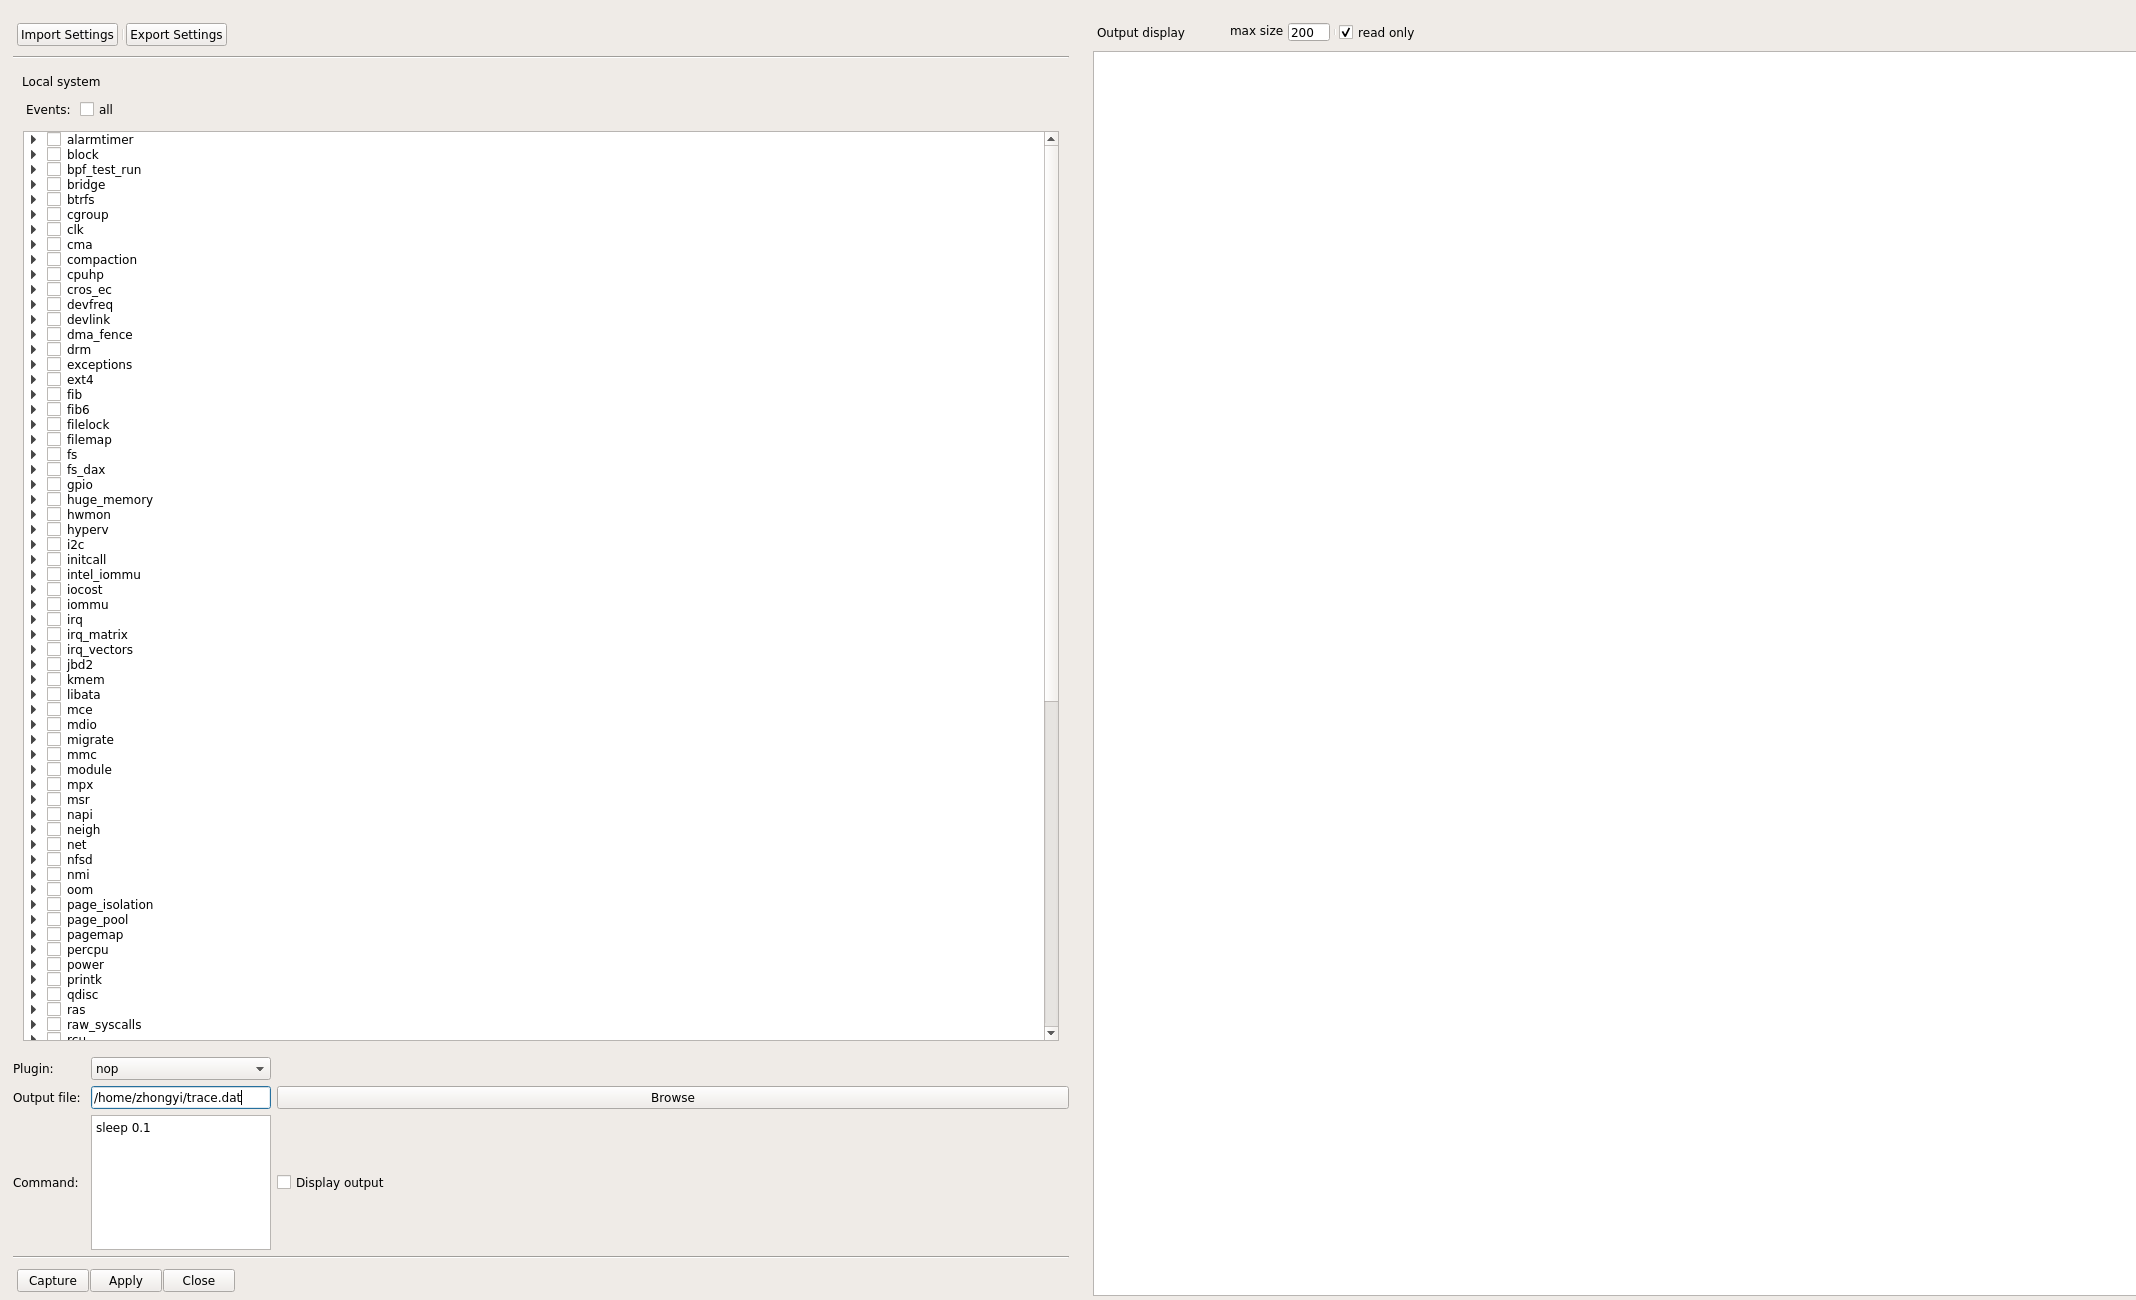
常用的设置有Events和Plugin,比如这里设置了sched_switch和sched_wakeup两个事件,选择了function_graph插件。
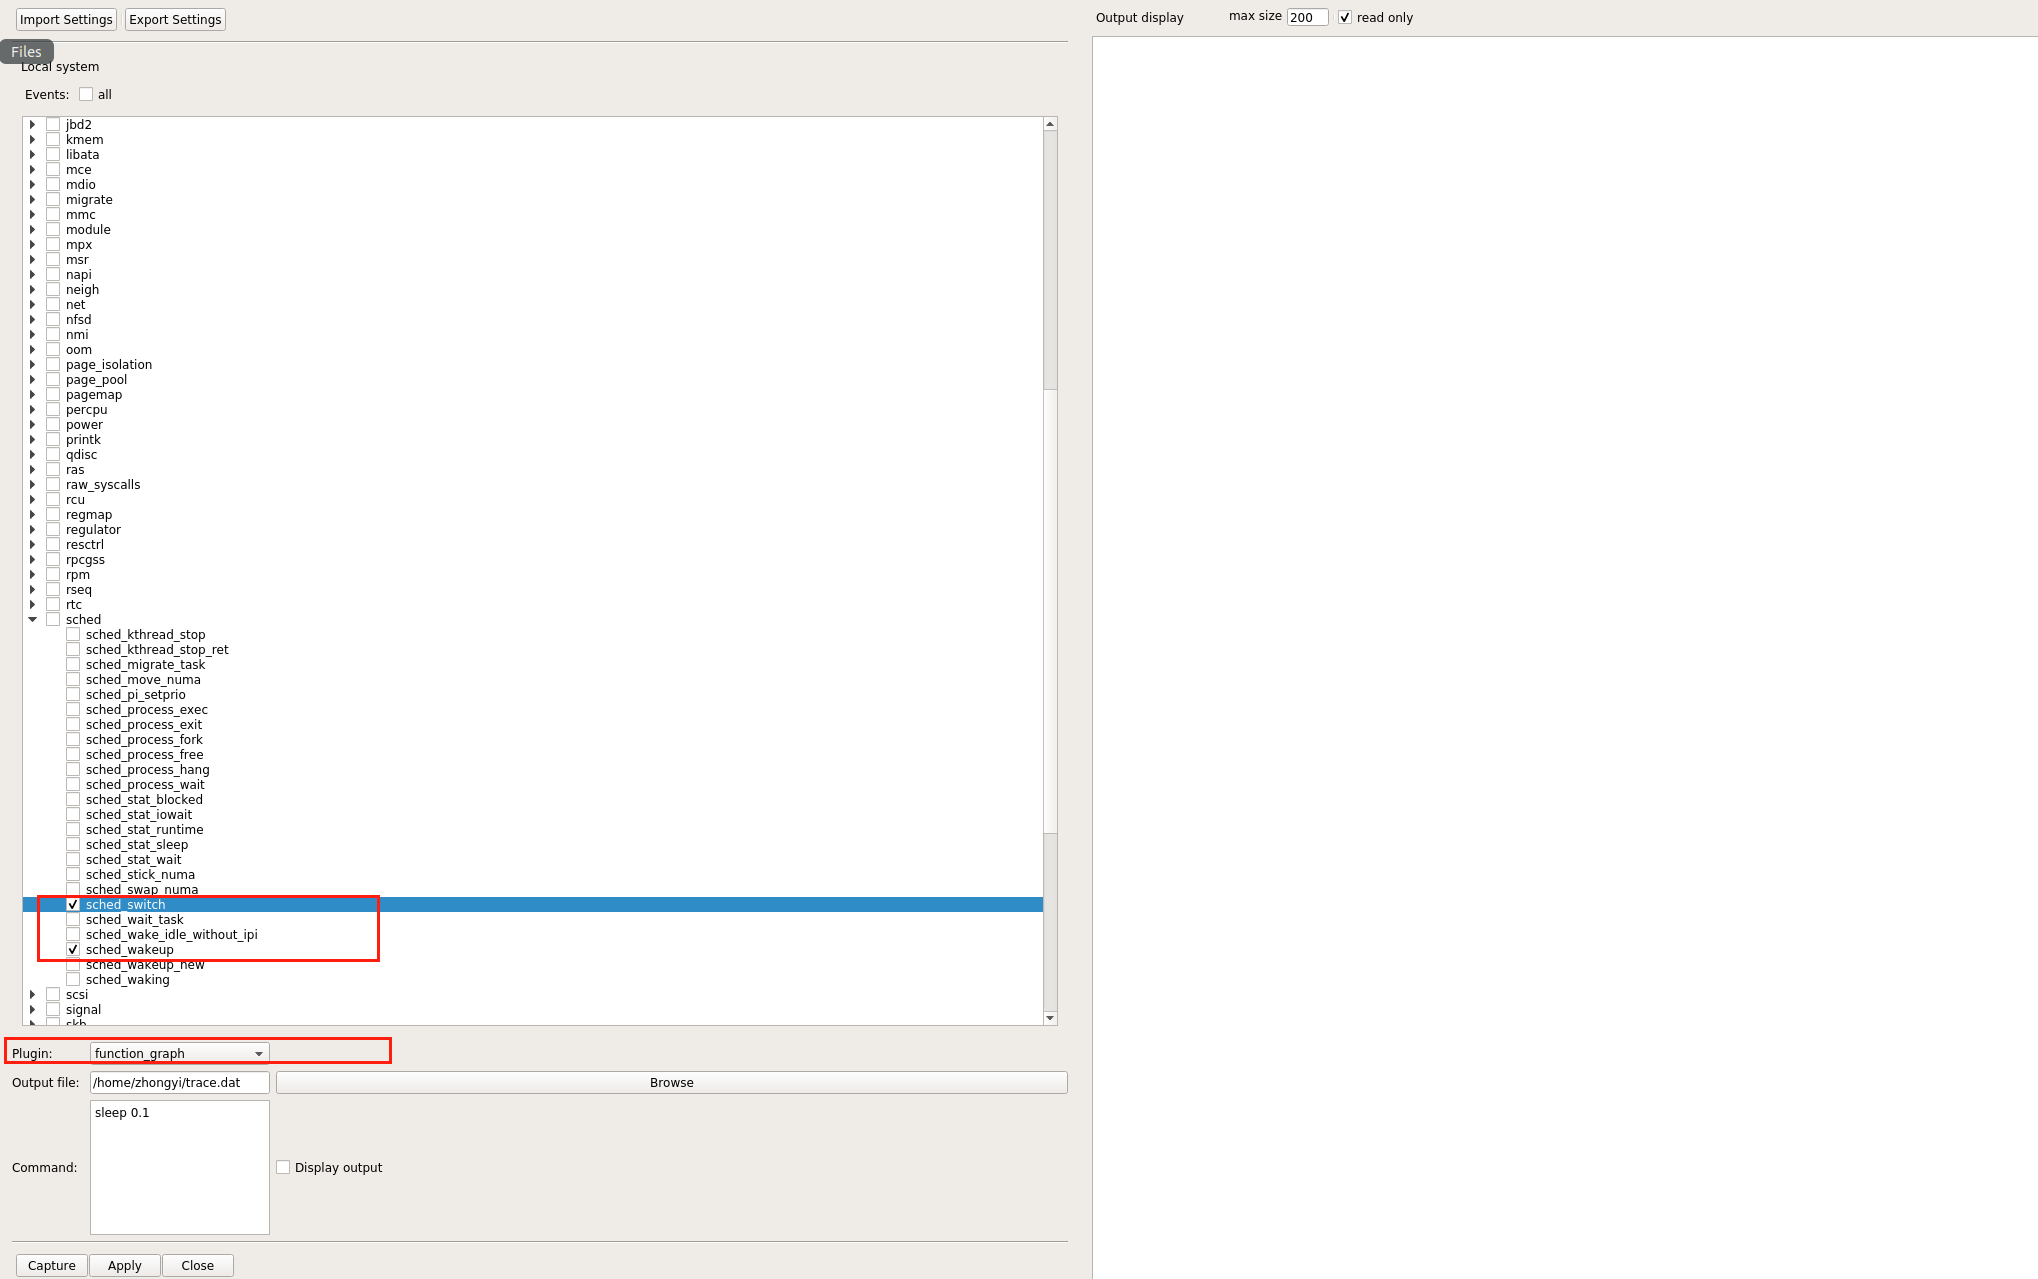
然后点击apply应用配置,capture开始捕获。ctrl+c可以停止捕获。

Close关闭后,可以在Kenelshark中查看细节。
可以看出这里不光显示了sched_switch和sched_wakeup事件,同时还显示了function_graph函数调用。

数据过滤
通常获取的数据需要进行一些过滤,才能发现问题。
filter提供了丰富的过滤功能,比如过滤事件,CPU,Tasks等。

也可以使用高级过滤功能,可以
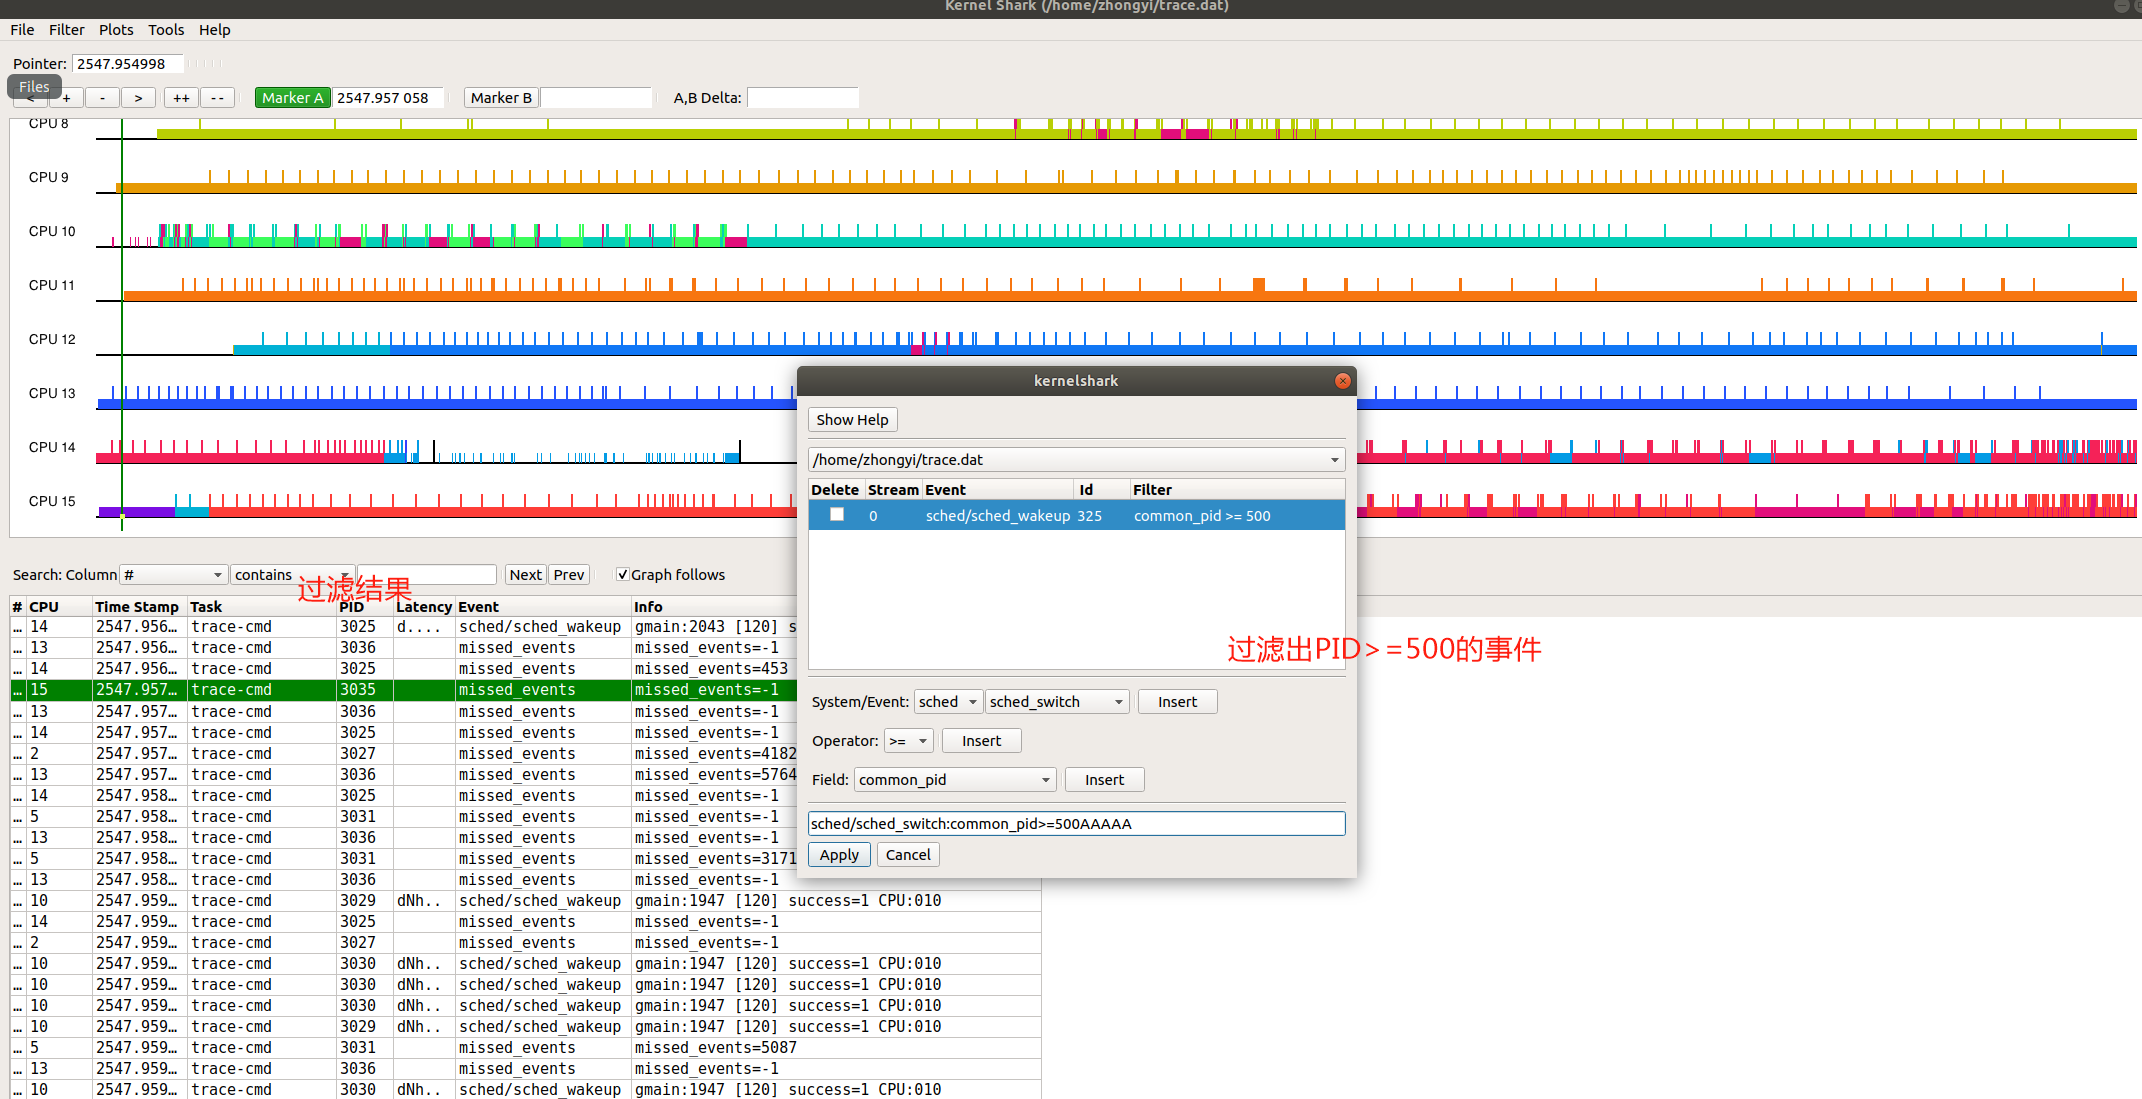
如果想清除所有过滤信息,点击clear all filters 即可。
图表过滤
Plots提供了CPU和Tasks的过滤,如下所示,我们选择只展示CPU0的nautilus进程。
[外链图片转存失败,源站可能有防盗链机制,建议将图片保存下来直接上传(img-sl34jTy7-1680877394097)(C:\Users\39580\AppData\Roaming\Typora\typora-user-images\image-20230204214745791.png)]
[外链图片转存失败,源站可能有防盗链机制,建议将图片保存下来直接上传(img-Zh2FNyDh-1680877394097)(C:\Users\39580\AppData\Roaming\Typora\typora-user-images\image-20230204214800081.png)]
最后筛选结果

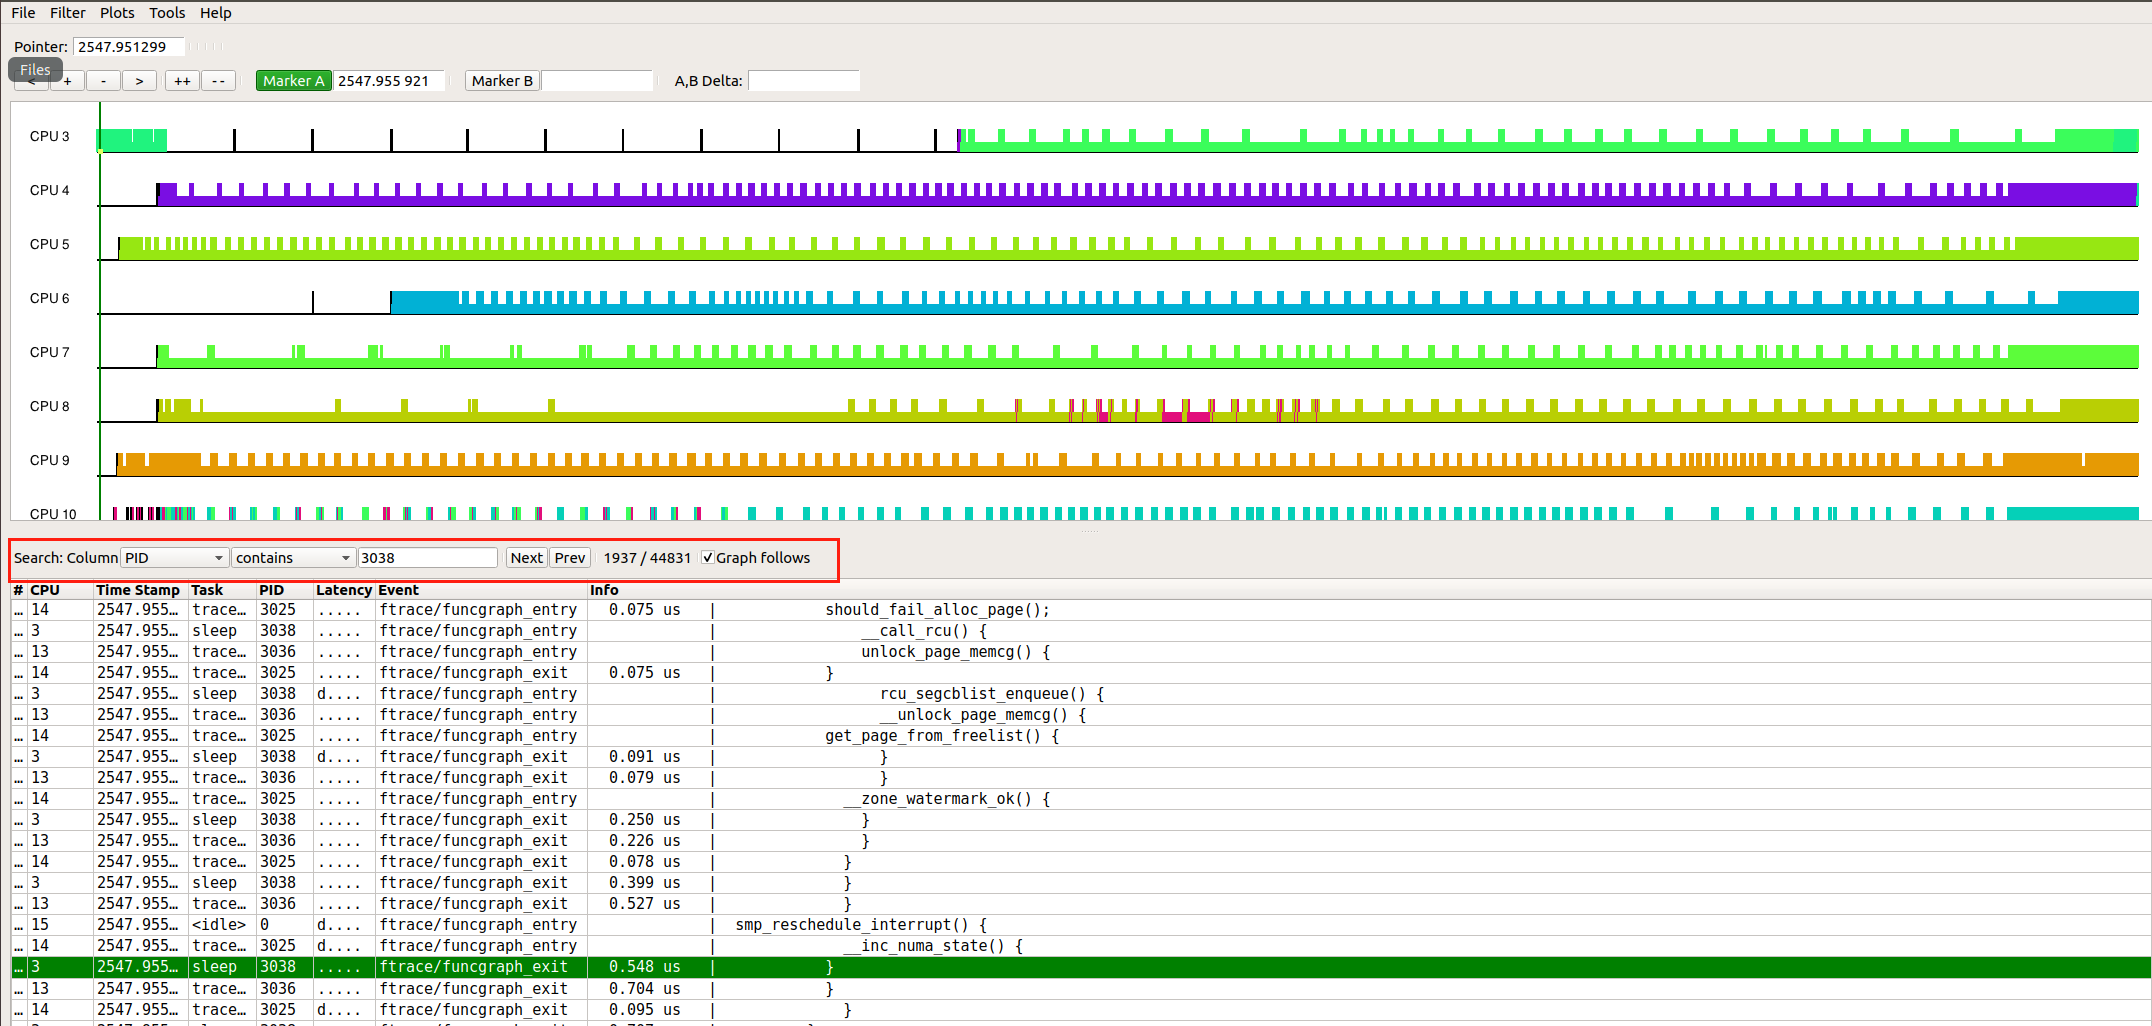
其它功能
还有一些其它有用的功能,比如搜索功能,选定要搜索的Column,文本框中输入字符串即可。
如下,我们筛选出PDI为3038的进程,总共找到44831个,当前是第1937个。
本文参考
https://git.kernel.org/pub/scm/utils/trace-cmd/kernel-shark.git/about/
https://git.kernel.org/pub/scm/linux/kernel/git/rostedt/trace-cmd.git/about/
https://github.com/rostedt/trace-cmd/tree/master/Documentation/trace-cmd
https://www.cnblogs.com/arnoldlu/p/9014365.html
https://cloud.tencent.com/developer/article/1876479
https://simpleiot.blog.csdn.net/article/details/103587609