文献速递:深度学习胰腺癌诊断--深度学习算法用于从疾病轨迹预测胰腺癌风险
麦田医学 美好事物中转站 2024-04-02 14:36
Title
题目
A deep learning algorithm to predict risk of
pancreatic cancer from disease trajectories
深度学习算法用于从疾病轨迹预测胰腺癌风险
01
文献速递介绍
胰腺癌是一种侵袭性疾病,通常在晚期发病并伴随着较差的预后,这表明迫切需要早期检测。在这项研究中,我们将人工智能方法应用于来自丹麦(丹麦国家患者注册处(DNPR))的600万患者(24,000例胰腺癌病例)和来自美国(美国退伍军人事务部(US-VA))的300万患者(3,900例病例)的临床数据上。我们在临床历史中的疾病代码序列上训练机器学习模型,并测试了在增量时间窗口内(CancerRiskNet)预测癌症发生的效果。对于36个月内的癌症发生,最佳DNPR模型的性能下的接收者操作特征(AUROC)曲线=0.88,当从训练中排除癌症诊断前3个月内的疾病事件时,AUROC降至(3m)=0.83,对于年龄超过50岁的1000名高风险患者,估计相对风险为59。将丹麦模型跨应用到US-VA数据上的性能较低(AUROC=0.71),需要重新训练以提高性能(AUROC=0.78,AUROC(3m)=0.76)。这些结果提高了为高风险患者设计现实监视计划的能力,通过早期检测这种侵袭性癌症,潜在地有益于延长寿命和提高生活质量。
Results
结果
Datasets
We used disease trajectories from the DNPR, with demographic infor mation from the Central Person Registry (CPR)36. DNPR covers approxi mately 8.6 million patients with 229 million hospital diagnoses, with, on average, 26.7 diagnosis codes per patient. For training, we used trajectories of International Classification of Diseases (ICD) diagnos tic codes, down to the three-character category in the ICD hierarchy, with explicit timestamps for each hospital contact from January 1977 to April 2018, for a total of 6.2 million patients after standard filter ing (Methods), including 23,985 pancreatic cancer cases (Fig. 2a,b,d, Table 1, Extended Data Figs. 1 and 2 and Supplementary Table 1). For validation in another healthcare system, we similarly used longitudinal clinical records from 1999 to 2020 from the US-VA CDW (data warehouse), which integrates both EHRs and cancer registry data nationwide (Fig. 2a,c,e). For training, we used trajectories from a selected dataset (Methods) with a total of 3.0 million patients, including 3,864 pancreatic cancer cases (Table 1 and Extended Data Fig. 3). On average, the health records in the US-VA dataset have shorter (median 12 years in US-VA versus 23 years in DNPR) but substantially denser disease histories (median 188 records per patient in US-VA versus 22 records per patient in DNPR). These differences likely reflect the dif ferences in population (entire population in Denmark versus military veterans in the US-VA) and in healthcare system practices, such as referral, documentation and billing.
数据集
我们使用了来自DNPR的疾病轨迹,以及来自中央人口注册处(CPR)的人口统计信息。DNPR涵盖了大约860万患者和2.29亿个医院诊断记录,平均每位患者有26.7个诊断代码。对于训练,我们使用了国际疾病分类(ICD)诊断代码的轨迹,精确到ICD层次结构中的三字符类别,并为从1977年1月至2018年4月的每次医院接触提供了明确的时间戳,经过标准过滤(方法)后,共有620万患者,包括23,985例胰腺癌病例(图2a,b,d,表1,扩展数据图1和2以及补充表1)。
为了在另一种卫生保健系统中进行验证,我们同样使用了来自美国退伍军人事务部CDW(数据仓库)的纵向临床记录,时间跨度为1999年至2020年,该数据仓库整合了全国的电子健康记录和癌症注册数据(图2a,c,e)。对于训练,我们使用了从选定数据集(方法)中得到的轨迹,总共包括300万患者,其中3,864例胰腺癌病例(表1和扩展数据图3)。平均而言,US-VA数据集中的健康记录(US-VA中位数为12年对比DNPR的23年)虽然时间跨度更短,但疾病历史显著更密集(US-VA中位数每位患者有188条记录对比DNPR的22条记录)。这些差异可能反映了人口(丹麦的整个人口对比美国退伍军人事务部的军事退伍者)和卫生保健系统实践(如转诊、文档记录和计费)之间的差异。
Method
方法
Processing of disease code trajectory datasets
We followed the MI-CLAIM checklist47 to improve the reporting of our methods. The checklist is available in Supplementary Table 6. Population-level DNPR dataset The first part of the project was conducted using a dataset of disease histories from the DNPR, covering all 229 million hospital diagnoses of 8.6 million patients between 1977 and 2018. This includes inpatient contacts since 1977 and outpatient and emergency department con tacts since 1995 but not data from general practitioners’ records34. Each entry of the database includes data on the start and end date of an admission or visit as well as diagnosis codes. The diagnoses are coded according to the ICD (ICD-8 until 1994 and ICD-10 since then). The accu
racy of cancer diagnosis disease codes, as examined by the Institute of Clinical Medicine, Aarhus University Hospital, has been reported to be 98% (accuracy for 19 Charlson conditions in 950 reviewed records)48.
For cancer diagnoses specifically, the reference evaluation was based on detailed comparisons among randomly sampled discharges from five different hospitals and review of a total of 950 samples34. We used both the ICD-8 code 157 and ICD-10 code C25, ‘malignant neoplasm of
pancreas’, to define pancreatic cancer cases.
人群水平DNPR数据集
项目的第一部分使用了来自DNPR的疾病历史数据集进行,涵盖了1977年到2018年间860万患者的2.29亿次医院诊断。这包括自1977年以来的住院接触,以及自1995年以来的门诊和急诊部门接触,但不包括普通执业医师记录的数据。数据库的每个条目都包含了入院或就诊的开始和结束日期以及诊断代码。诊断按照ICD(1994年之前为ICD-8,之后为ICD-10)编码。奥胡斯大学医院临床医学研究所检查的癌症诊断疾病代码的准确性已被报告为98%(在950份审查记录中对19个查尔森条件的准确性)。对于特定的癌症诊断,参考评估是基于从五个不同医院随机抽取的出院记录之间的详细比较和对总共950个样本的审查。我们使用了ICD-8代码157和ICD-10代码C25,“胰腺恶性肿瘤”,来定义胰腺癌病例。
Figure
图

Fig. 1 | Training and prediction of pancreatic cancer risk from disease trajectories. a, Learning: The general ML workflow starts with partitioning the data into a training set (Train), a development set (Dev) and a test set (Test). The trajectories for training input are generated by sampling continuous subsequences of diagnoses for each patient’s diagnosis history, each starting with the first record but with different endpoints. The training and development sets are used for training so as to minimize the prediction error—that is, the difference between a risk score function (prediction) and a step function (observation), summed over all instances. Prediction: A model’s ability to accurately predict is evaluated using the withheld test set. The prediction model, depending on the prediction threshold selected from among possible operational points, discriminates between patients at higher and lower risk of pancreatic cancer. The risk model can guide the development of surveillance initiatives. b, The model trained with real-world clinical data has three steps: embedding, encoding and prediction. The embedding machine transforms categorical disease codes and timestamps of these disease codes into a lower-dimensional real number continuous space. The encoding machine extracts information from a disease history and summarizes each sequence in a characteristic fingerprint in the latent space (vertical vector). The prediction machine then uses the fingerprint to generate predictions for cancer occurrence within different time intervals after the time of assessment (3, 6, 12, 36 and 60 months). The model parameters are trained by minimizing the difference between the predicted and the observed cancer occurrence. c, Terminology for timepoints and intervals. The last event of a disease trajectory coincides with the time of assessment. From the time of assessment, cancer risk is assessed within 3, 6, 12, 36 and 60 months. To test the influence of close-to-cancer diagnosis codes on the prediction of cancer occurrence, exclusion intervals are used to remove diagnoses in the last 3, 6 and 12 months before cancer diagnosis.
图1 | 从疾病轨迹预测胰腺癌风险的训练和预测
a,学习:通用的机器学习工作流程从将数据划分为训练集(训练)、开发集(开发)和测试集(测试)开始。训练输入的轨迹是通过对每个患者的诊断历史进行连续子序列的采样生成的,每个序列都以第一条记录开始,但终点不同。训练和开发集被用于训练,以最小化预测误差——即,风险得分函数(预测)与阶跃函数(观察)之间的差异,对所有实例求和。预测:使用保留的测试集评估模型准确预测的能力。根据从可能的操作点中选择的预测阈值,预测模型区分高和低胰腺癌风险的患者。风险模型可以指导监测计划的开发。b,用真实世界临床数据训练的模型包括三个步骤:嵌入、编码和预测。嵌入机将分类疾病代码和这些疾病代码的时间戳转换为一个较低维度的实数连续空间。编码机从疾病历史中提取信息,并在潜在空间中(垂直向量)总结每个序列的特征指纹。然后预测机使用该指纹生成评估时间之后不同时间间隔内(3、6、12、36和60个月)癌症发生的预测。模型参数通过最小化预测和观察到的癌症发生之间的差异来训练。c,时间点和间隔的术语。疾病轨迹的最后一个事件与评估时间重合。从评估时间开始,在3、6、12、36和60个月内评估癌症风险。为了测试接近癌症诊断的代码对癌症发生预测的影响,使用排除间隔来去除癌症诊断前最后3、6和12个月的诊断。

Fig. 2 | Characteristics of the Danish and US-VA patient registries. a, Distributions for age at pancreatic cancer diagnosis in the two cohorts. b,c, The Danish (DK) dataset has a longer median length of disease trajectories but lower median number of disease codes per patient compared to the US-VA dataset, so the ML process, independently in each dataset, has to cope with very different distributions of disease trajectories in terms of length of trajectories and density of the number of disease codes. Color level indicates the number of patients in a given bin. d,e, Background check on the distribution disease codes in the clinical records: prevalence of known risk factors in cancer versus non-cancer patients in the DK (d) and US-VA (e) datasets, counting whether a disease code occurred at least once in a patient’s history previous to their pancreatic cancer code (cancer) or 2 years previous to the end of data (no cancer).
图2 | 丹麦和美国退伍军人事务部患者注册处的特点。
a,两个队列中胰腺癌诊断年龄的分布。b,c,丹麦(DK)数据集的疾病轨迹中位长度较长,但每位患者的疾病代码中位数较美国退伍军人事务部数据集少,因此,机器学习过程必须独立应对每个数据集中轨迹长度和疾病代码数量密度的非常不同的分布。颜色等级表示给定区间内的患者数量。d,e,临床记录中疾病代码分布的背景检查:在丹麦(d)和美国退伍军人事务部(e)数据集中,对癌症与非癌症患者已知风险因素的普遍性进行统计,计算在患者的胰腺癌代码(癌症)之前或数据结束前2年(无癌症)的历史中,疾病代码是否至少出现过一次。
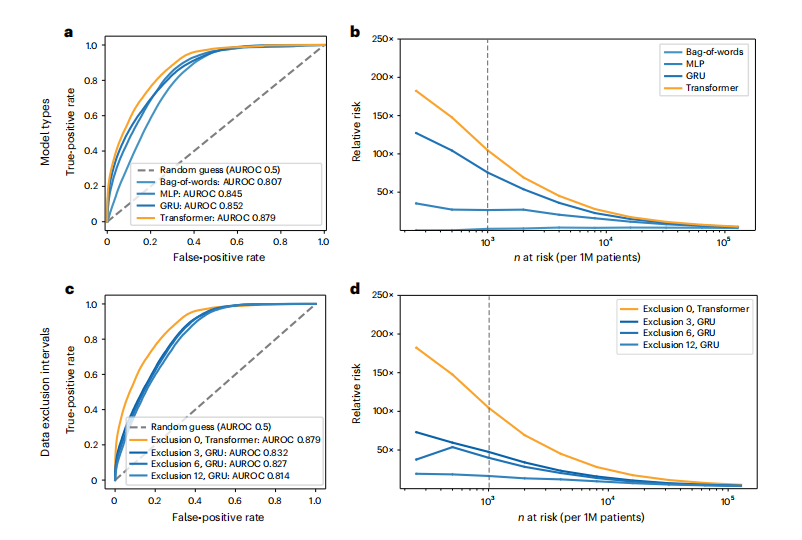
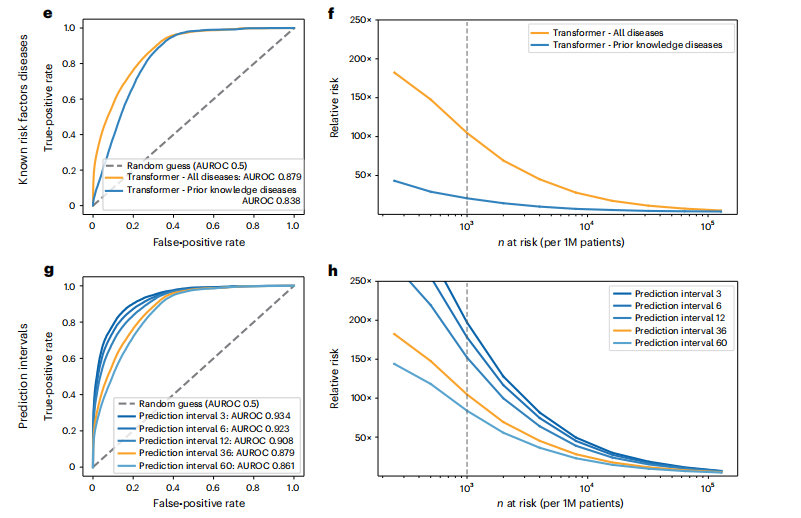
Fig. 3 | Performance of the ML model on clinical record trajectories inpredicting pancreatic cancer occurrence in the Danish dataset. For each model and prediction evaluation, performance is better for larger AUROC (a,c,e,g) and for higher RR (Relative risk) for the n (horizontal axis) highest-risk patients (b,d,f,h). a,b, Choice of algorithm: The Transformer algorithm is best with AUROC = 0.879 (no data exclusion, 36-month prediction interval). c,d, Choice of input data: Prediction performance declines with exclusion interval, in training, of k = 3, 6 and 12 months of data between the end of a disease trajectory and cancer occurrence (best model for each exclusion interval, for 36-month prediction interval). e,f, Choice of input data: Prediction is better for all 2,000 ICD level-3 disease codes used throughout in training (Methods) compared to only the subset of 23 known risk factors, using a Transformer, all data (Exclusion 0), for the 36-month prediction interval. g,h, Choice of prediction task: Prediction of cancer is more difficult for larger prediction intervals, the time interval within which cancer is predicted to occur after assessment (Transformer model, all data). We reported prediction performance for the 36-month prediction interval (orange in g and h) in the above panels (a-f), as this is a reasonable choice for design of a surveillance program in clinical practice. b,d,f,h, Prediction performance at a particular operational point—for example (d), for n = 1,000 highest-risk patients (vertical dotted line) out of 1 million (1M) patients, the RR is 104.7 for the 36-month prediction interval using all data and 47.6 with 3-month data exclusion.
图3 | 在丹麦数据集中使用机器学习模型对临床记录轨迹预测胰腺癌发生的性能。对于每个模型和预测评估,更大的AUROC(a,c,e,g)和对n(水平轴)最高风险患者更高的RR(相对风险)表示性能更好(b,d,f,h)。a,b,算法选择:Transformer算法在没有数据排除的情况下,36个月预测间隔的AUROC=0.879,表现最佳。c,d,输入数据选择:随着训练中排除间隔k = 3,6和12个月的数据(从疾病轨迹结束到癌症发生之间的时间),预测性能下降(每个排除间隔的最佳模型,36个月预测间隔)。e,f,输入数据选择:与仅使用23个已知风险因素的子集相比,整个训练过程中使用的所有2000个ICD 3级疾病代码的预测更好(方法),使用Transformer,所有数据(排除0),对于36个月预测间隔。g,h,预测任务选择:预测癌症对于更大的预测间隔更困难,即在评估之后预测癌症发生的时间间隔(Transformer模型,所有数据)。我们报告了36个月预测间隔的预测性能(g和h中的橙色),如上面的面板(a-f)所示,因为这是临床实践中设计监测程序的合理选择。b,d,f,h,在特定操作点的预测性能——例如(d),对于n = 1,000最高风险患者(垂直虚线)中的1百万(1M)患者,使用所有数据的36个月预测间隔的RR为104.7,而排除3个月数据的RR为47.6。
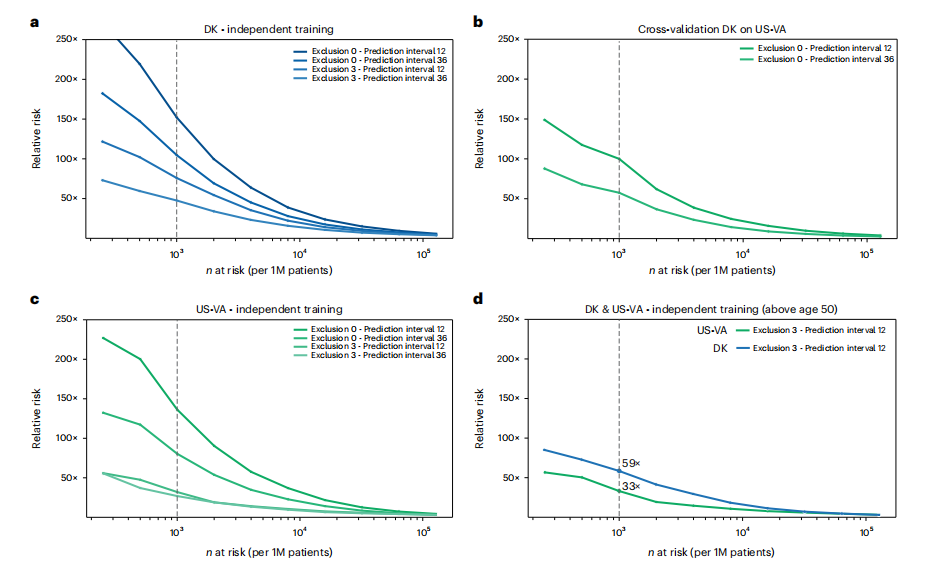
Fig. 4 | Estimated performance of a surveillance program for high-risk patients in different health systems and with different operational choices. Estimated relative risk (RR) for the top n (horizontal axis) high-risk patients is based on evaluating the accuracy of prediction on the withheld test set (a,c,d)and on a full external dataset (b). a,c, In designing surveillance programs, one can choose between models trained on all data (Exclusion 0) versus models trained excluding data from the last 3 months before cancer occurrence (Exclusion 3) and between prediction for cancer within 12 months or 36 months of assessment (legend top right in each panel). b, Estimated performance is somewhat lower for cross-application of a model trained on Danish (DK) data applied to US-VA patient data, illustrating the challenge of deriving globally valid prediction tools without independent localized or system-specific training. d, A proposed practical choice for a surveillance program with good estimated accuracy of prediction, in either system, would involve application of independently trained models with 3-month data exclusion for a prediction interval of 12 months for patients older than age 50 years. 1M, 1 million.
图4 | 在不同卫生系统和不同操作选择下,针对高风险患者的监测计划的估计性能。顶部n(水平轴)高风险患者的估计相对风险(RR)是基于对保留测试集(a,c,d)和完整外部数据集(b)上的预测准确性评估得出的。a,c,在设计监测计划时,可以选择在所有数据上训练的模型(排除0)与排除癌症发生前最后3个月的数据训练的模型(排除3)之间选择,并且可以选择在评估后12个月内或36个月内预测癌症(每个面板右上角的图例)。b,用丹麦(DK)数据训练的模型应用于美国退伍军人事务部(US-VA)患者数据的估计性能稍低,这说明了在没有独立的本地化或系统特定训练的情况下,推导全球有效的预测工具的挑战。d,对于任一系统,一个提出的实际选择的监测计划,具有良好的预测准确性估计,将涉及应用独立训练的模型,排除3个月数据,对于年龄超过50岁的患者,预测间隔为12个月。1M,一百万。

Fig. 5 | Predictive capacity and feature contributions of disease trajectories. a,c, Distribution of recall (sensitivity) values at the F1 operational point (Methods) as a function of time to cancer (time between the end of a disease trajectory and cancer diagnosis). As expected, recall levels decrease with longer time to cancer, from 8% for cancer occurring about 1 year after assessment to a recall of 4% for cancer occurring about 3 years after assessment (DNPR). This suggests that the model learns not only from symptoms very close to pancreatic cancer but also from longer disease histories, albeit at lower accuracy. a, Danish system (DK), for models trained on all data (no data exclusion). c, US-VA system, for models trained on all data. b,d, Top 10 features that contribute to the cancer prediction in time-to-cancer intervals of 0–6, 6–12, 12–24 and 24–36 months for the Danish (DK) (b) and US-VA (d) systems. The features are sorted by the contribution score (Supplementary Table 5). We used an integrated gradients (IG) method to calculate the contribution score for each input feature for each trajectory and then summed over all trajectories with cancer diagnosis within the indicated time interval.
图5 | 疾病轨迹的预测能力和特征贡献。
a,c,在F1操作点(方法)的召回率(敏感性)值的分布,作为距癌症(从疾病轨迹结束到癌症诊断之间的时间)时间的函数。如预期,随着距离癌症的时间延长,召回率水平下降,从评估后大约1年内发生的癌症的8%下降到评估后大约3年内发生的癌症的召回率为4%(DNPR)。这表明模型不仅从非常接近胰腺癌的症状中学习,而且还从更长的疾病历史中学习,尽管准确性较低。a,丹麦系统(DK),对所有数据(无数据排除)训练的模型。c,美国退伍军人事务部(US-VA)系统,对所有数据训练的模型。b,d,对于丹麦(DK)(b)和美国退伍军人事务部(d)系统,在0-6个月、6-12个月、12-24个月和24-36个月的癌症预测时间间隔内,对癌症预测贡献最大的前10个特征。特征按贡献分数排序(补充表5)。我们使用一个综合梯度(IG)方法计算每个输入特征在每个轨迹中的贡献分数,然后将所有在指定时间间隔内有癌症诊断的轨迹的贡献分数求和。
Table
表

Table 1 | Characteristics of the Danish and US-VA datasets knowledge and limit the input for training to known risk factors—that is, diseases that have been reported to be indicative of the likely occur rence of pancreatic cancer11,39. We found that prediction performance with the subset of ICD codes for 23 known risk factors reduces predic tion accuracy of the Transformer model to AUROC = 0.838 compared to AUROC = 0.879 for all diagnosis codes, and, therefore, we used the latter (ICD level-3, 2,000 disease codes) throughout the rest of thework (Fig. 3e,f and Supplementary Table 4).
表1 | 丹麦和美国退伍军人事务部数据集的特点
将知识限定在已知风险因素上,并将训练输入限制为已知的风险因素——即,已被报道可能预示胰腺癌发生的疾病。我们发现,使用23个已知风险因素的ICD代码子集进行预测,Transformer模型的预测准确性降低到AUROC=0.838,与使用所有诊断代码的AUROC=0.879相比,因此,我们在余下的工作中使用后者(ICD 3级,2,000个疾病代码)(图3e,f和补充表4)。