目录
- 1、使用普通方式安装prometheus和grafana
- 1.1、安装kube-state-metrics容器
- 1.1.1、下载并修改yaml文件
- 1.1.2、导入kube-state-metrics镜像
- 1.1.3、执行yaml文件目录
- 1.2、安装node-exploer
- 1.2.1、创建名称空间prometheus
- 1.2.2、执行yaml
- 1.3、安装prometheus
- 1.3.1、创建集群角色、账户、绑定
- 1.3.2、创建prometheus
- 1.4、安装grafana
- 1.5、配置可视化大屏
- 1.5.1、登录grafana首页
- 1.5.2、配置prometheus作为数据源
- 1.5.3、配置可视化大屏
- 1.6、问题排查方案
- 1.7、参考文档
- 2、安装loki
- 2.1、创建名称空间logging
- 2.2、安装loki
- 2.3、安装loki-promtail
- 2.3、判断loki是否安装成功
- 2.5、在grafana中配置loki
- 2.6、在grafana中使用loki
- 3、安装postgresql
- 3.1、创建名称空间postgresql
- 3.2、执行yaml
- 3.3、使用Navicat连接postgresql
- 4、安装doris(TODO 最后搭建起来还是会报错,后续在解决吧)
- 4.1、创建名称空间doris-cluster
- 4.2、搭建doris-be-cluster服务
- 4.3、搭建doris-cn-cluster服务
- 4.4、搭建doris-follower-cluster服务
1、使用普通方式安装prometheus和grafana
1.1、安装kube-state-metrics容器
1.1.1、下载并修改yaml文件
直接下载最终结果:
考虑到文件查找步骤的描述较多,我本次直接给大家提供这些yaml文件的百度网盘链接,然后kube-state-metrics版本是2.5.0,部署的名称空间是kube-system
链接:https://pan.baidu.com/s/1vnUMmlDexRi_Dd6vq9u87A?pwd=7728
提取码: 7728
文件查找步骤(当百度网盘中文件不符合要求时在看):
首先yaml文件存储在gitlab中,地址是:https://github.com/kubernetes/kube-state-metrics/
但是gitlab经常无法访问,所以给大家找到一个gitee地址(同步gitlab代码),地址是:https://gitee.com/pigmanwlj/kube-state-metrics
然后确定镜像版本,比如我本次使用版本信息是2.5,那就在上述gitee链接中找到版本为2.5的分支,地址是:https://gitee.com/pigmanwlj/kube-state-metrics/tree/release-2.5/
然后yaml文件放在kube-state-metrics/examples/standard路径下面,地址是:https://gitee.com/pigmanwlj/kube-state-metrics/tree/release-2.5/examples/standard
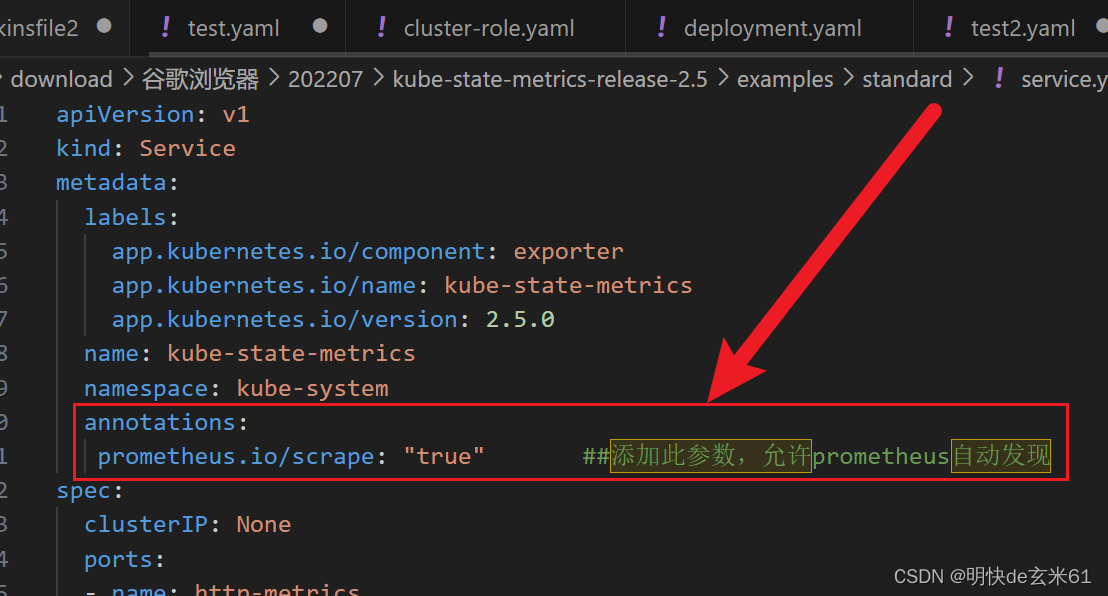
然后需要打开service.yaml,在名称空间后面添加如下内容:
annotations:prometheus.io/scrape: "true" ##添加此参数,允许prometheus自动发现
添加结果如下:
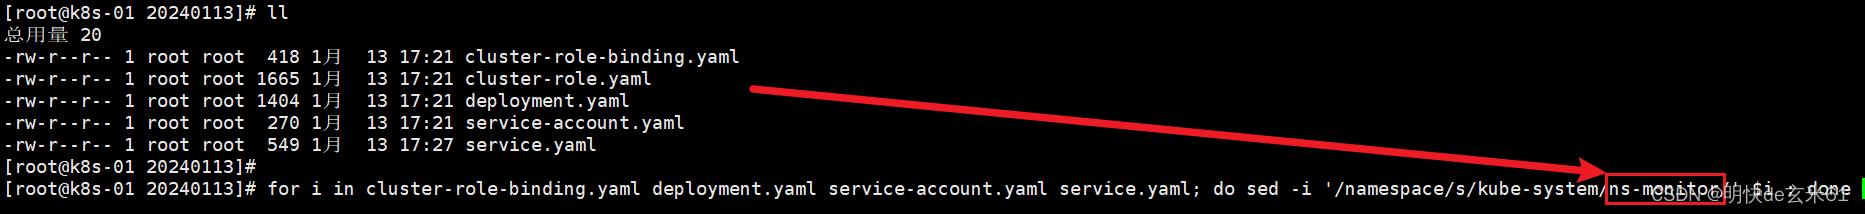
默认使用名称空间kube-system,如果想要修改名称空间,可以把standard目录下的所有yaml文件传到linux上,然后使用以下指定实现名称空间的更换
for i in cluster-role-binding.yaml deployment.yaml service-account.yaml service.yaml; do sed -i '/namespace/s/kube-system/新名称空间/' $i ; done
例如把名称空间换成ns-monitor,操作如下:
1.1.2、导入kube-state-metrics镜像
上面已经下载了yaml文件目录,里面包含deployment.yaml,看下里面image后面的镜像
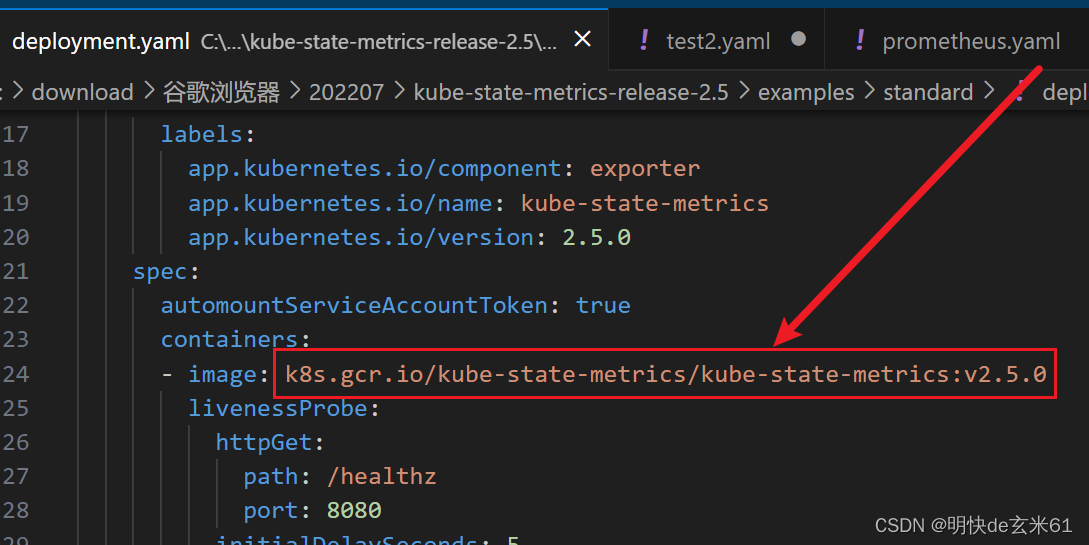
比如2.5.0版本的镜像是k8s.gcr.io/kube-state-metrics/kube-state-metrics:v2.5.0,但是由于网络原因,所以无法通过docker pull命令拉取到本地,这场我直接把2.5.0版本的镜像提供给你,百度网盘下载链接在下面
下载之后通过docker load -i kube-state-metrics_v2.5.0.tar导入即可
链接:https://pan.baidu.com/s/1RNO-z70sORi8mPHdMpB_Eg?pwd=msv1
提取码:msv1
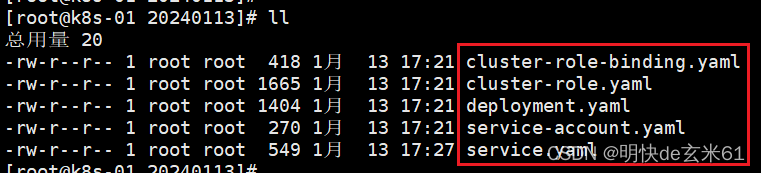
1.1.3、执行yaml文件目录
我们把yaml文件目录上传到k8s主节点所在虚拟机上
然后执行如下指令,该指令将会执行目录下的所有yaml文件
kubectl apply -f ./
1.2、安装node-exploer
1.2.1、创建名称空间prometheus
直接在kuboard平台操作
1.2.2、执行yaml
apiVersion: apps/v1
kind: DaemonSet
metadata:annotations:deprecated.daemonset.template.generation: '2'labels:app: node-exportername: node-exporternamespace: prometheus
spec:selector:matchLabels:app: node-exportertemplate:metadata:labels:app: node-exportername: node-exporterspec:containers:- image: 'prom/node-exporter:latest'imagePullPolicy: IfNotPresentname: node-exporterports:- containerPort: 9100hostPort: 9100protocol: TCP---apiVersion: v1
kind: Service
metadata:annotations:prometheus.io/scrape: 'true' ##添加此参数,允许prometheus自动发现labels:k8s-app: node-exportername: node-exporternamespace: prometheus
spec:ports:- name: httpnodePort: 31672port: 9100protocol: TCPtargetPort: 9100selector:app: node-exportertype: NodePort
注意: 如果无法下载镜像,或者后续执行有问题,都可以使用docer load -i 镜像tar包导入以下镜像
链接:https://pan.baidu.com/s/1uA4XHKfGsWjOBz6fONPS3g?pwd=2axl
提取码:2axl
1.3、安装prometheus
1.3.1、创建集群角色、账户、绑定
apiVersion: rbac.authorization.k8s.io/v1
kind: ClusterRole
metadata:annotations:rbac.authorization.kubernetes.io/autoupdate: 'true'name: prometheus
rules:- apiGroups:- ''resources:- nodes- nodes/proxy- services- endpoints- podsverbs:- get- list- watch- apiGroups:- networking.k8s.ioresources:- ingressesverbs:- get- list- watch---apiVersion: v1
kind: ServiceAccount
metadata:name: prometheusnamespace: prometheus---apiVersion: rbac.authorization.k8s.io/v1
kind: ClusterRoleBinding
metadata:name: prometheus
roleRef:apiGroup: rbac.authorization.k8s.iokind: ClusterRolename: prometheus
subjects:
- kind: ServiceAccountname: prometheusnamespace: prometheus
1.3.2、创建prometheus
---
apiVersion: v1
data:prometheus.yml: |-global:scrape_interval:     15sevaluation_interval: 15sscrape_configs:- job_name: 'kubernetes-nodes'kubernetes_sd_configs:- role: nodescheme: httpstls_config:ca_file: /var/run/secrets/kubernetes.io/serviceaccount/ca.crtbearer_token_file: /var/run/secrets/kubernetes.io/serviceaccount/tokenrelabel_configs:- action: labelmapregex: __meta_kubernetes_node_label_(.+)- target_label: __address__replacement: kubernetes.default.svc:443- source_labels: [__meta_kubernetes_node_name]regex: (.+)target_label: __metrics_path__replacement: /api/v1/nodes/${1}/proxy/metrics- job_name: 'kubernetes-cadvisor'kubernetes_sd_configs:- role: nodescheme: httpstls_config:ca_file: /var/run/secrets/kubernetes.io/serviceaccount/ca.crtbearer_token_file: /var/run/secrets/kubernetes.io/serviceaccount/tokenrelabel_configs:- action: labelmapregex: __meta_kubernetes_node_label_(.+)- target_label: __address__replacement: kubernetes.default.svc:443- source_labels: [__meta_kubernetes_node_name]regex: (.+)target_label: __metrics_path__replacement: /api/v1/nodes/${1}/proxy/metrics/cadvisormetric_relabel_configs:- source_labels: [instance]separator: ;regex: (.+)target_label: nodereplacement: $1action: replace - source_labels: [pod_name]separator: ;regex: (.+)target_label: podreplacement: $1action: replace- source_labels: [container_name]separator: ;regex: (.+)target_label: containerreplacement: $1action: replace       - job_name: 'kubernetes-service-endpoints'kubernetes_sd_configs:- role: endpointsrelabel_configs:- source_labels: [__meta_kubernetes_service_annotation_prometheus_io_scrape]action: keepregex: true- source_labels: [__meta_kubernetes_service_annotation_prometheus_io_scheme]action: replacetarget_label: __scheme__regex: (https?)- source_labels: [__meta_kubernetes_service_annotation_prometheus_io_path]action: replacetarget_label: __metrics_path__regex: (.+)- source_labels: [__address__, __meta_kubernetes_service_annotation_prometheus_io_port]action: replacetarget_label: __address__regex: ([^:]+)(?::\d+)?;(\d+)replacement: $1:$2- action: labelmapregex: __meta_kubernetes_service_label_(.+)- source_labels: [__meta_kubernetes_namespace]action: replacetarget_label: kubernetes_namespace- source_labels: [__meta_kubernetes_service_name]action: replacetarget_label: kubernetes_name- source_labels: [__meta_kubernetes_pod_container_port_number]action: replacetarget_label: container_port- job_name: kube-state-metricskubernetes_sd_configs:- role: endpointsrelabel_configs:- source_labels: [__meta_kubernetes_service_label_app_kubernetes_io_name]regex: kube-state-metricsreplacement: $1action: keep- action: labelmapregex: __meta_kubernetes_service_label_(.+)- source_labels: [__meta_kubernetes_namespace]action: replacetarget_label: k8s_namespace- source_labels: [__meta_kubernetes_service_name]action: replacetarget_label: k8s_sname       - job_name: 'prometheus'static_configs:- targets: ['prometheus.prometheus:9090']
kind: ConfigMap
metadata:name: prometheus-confignamespace: prometheus---
apiVersion: apps/v1
kind: Deployment
metadata:labels:name: prometheus-deploymentname: prometheusnamespace: prometheus
spec:selector:matchLabels:app: prometheustemplate:metadata:labels:app: prometheusspec:containers:- args:- '--config.file=/etc/prometheus/prometheus.yml'- '--storage.tsdb.path=/prometheus'- '--storage.tsdb.retention=24h'command:- /bin/prometheusimage: 'prom/prometheus:latest'imagePullPolicy: IfNotPresentname: prometheusports:- containerPort: 9090protocol: TCPvolumeMounts:- mountPath: /prometheusname: data- mountPath: /etc/prometheusname: config-volumeserviceAccount: prometheus # 使用上面创建的用户,不能使用default用户,避免出现权限不足的问题serviceAccountName: prometheus # 使用上面创建的用户,不能使用default用户,避免出现权限不足的问题volumes:- emptyDir: {}name: data- configMap:name: prometheus-configname: config-volume---apiVersion: v1
kind: Service
metadata:labels:app: prometheusname: prometheusnamespace: prometheus
spec:ports:- nodePort: 30003port: 9090protocol: TCPtargetPort: 9090selector:app: prometheustype: NodePort
1.4、安装grafana
---
apiVersion: v1
data:default.ini: >##################### Grafana Configuration Defaults ####################### Do not modify this file in grafana installs## possible values : production, developmentapp_mode = production# instance name, defaults to HOSTNAME environment variable value or hostnameif HOSTNAME var is emptyinstance_name = ${HOSTNAME}#################################### Paths ###############################[paths]# Path to where grafana can store temp files, sessions, and the sqlite3 db(if that is used)data = data# Temporary files in `data` directory older than given duration will beremovedtemp_data_lifetime = 24h# Directory where grafana can store logslogs = data/log# Directory where grafana will automatically scan and look for pluginsplugins = data/plugins# folder that contains provisioning config files that grafana will apply onstartup and while running.provisioning = conf/provisioning#################################### Server ##############################[server]# Protocol (http, https, h2, socket)protocol = http# The ip address to bind to, empty will bind to all interfaceshttp_addr =# The http port to usehttp_port = 3000# The public facing domain name used to access grafana from a browserdomain = localhost# Redirect to correct domain if host header does not match domain# Prevents DNS rebinding attacksenforce_domain = false# The full public facing urlroot_url = %(protocol)s://%(domain)s:%(http_port)s/# Serve Grafana from subpath specified in `root_url` setting. By default itis set to `false` for compatibility reasons.serve_from_sub_path = false# Log web requestsrouter_logging = false# the path relative working pathstatic_root_path = public# enable gzipenable_gzip = false# https certs & key filecert_file =cert_key =# Unix socket pathsocket = /tmp/grafana.sock# CDN Urlcdn_url =# Sets the maximum time in minutes before timing out read of an incomingrequest and closing idle connections.# `0` means there is no timeout for reading the request.read_timeout = 0#################################### Database ############################[database]# You can configure the database connection by specifying type, host, name,user and password# as separate properties or as on string using the url property.# Either "mysql", "postgres" or "sqlite3", it's your choicetype = sqlite3host = 127.0.0.1:3306name = grafanauser = root# If the password contains # or ; you have to wrap it with triple quotes. Ex"""#password;"""password =# Use either URL or the previous fields to configure the database# Example: mysql://user:secret@host:port/databaseurl =# Max idle conn setting default is 2max_idle_conn = 2# Max conn setting default is 0 (mean not set)max_open_conn =# Connection Max Lifetime default is 14400 (means 14400 seconds or 4 hours)conn_max_lifetime = 14400# Set to true to log the sql calls and execution times.log_queries =# For "postgres", use either "disable", "require" or "verify-full"# For "mysql", use either "true", "false", or "skip-verify".ssl_mode = disable# Database drivers may support different transaction isolation levels.# Currently, only "mysql" driver supports isolation levels.# If the value is empty - driver's default isolation level is applied.# For "mysql" use "READ-UNCOMMITTED", "READ-COMMITTED", "REPEATABLE-READ" or"SERIALIZABLE".isolation_level =ca_cert_path =client_key_path =client_cert_path =server_cert_name =# For "sqlite3" only, path relative to data_path settingpath = grafana.db# For "sqlite3" only. cache mode setting used for connecting to the databasecache_mode = private# For "mysql" only if lockingMigration feature toggle is set. How manyseconds to wait before failing to lock the database for the migrations,default is 0.locking_attempt_timeout_sec = 0#################################### Cache server#############################[remote_cache]# Either "redis", "memcached" or "database" default is "database"type = database# cache connectionstring options# database: will use Grafana primary database.# redis: config like redis server e.g.`addr=127.0.0.1:6379,pool_size=100,db=0,ssl=false`. Only addr is required.ssl may be 'true', 'false', or 'insecure'.# memcache: 127.0.0.1:11211connstr =#################################### Data proxy ###########################[dataproxy]# This enables data proxy logging, default is falselogging = false# How long the data proxy waits to read the headers of the response beforetiming out, default is 30 seconds.# This setting also applies to core backend HTTP data sources where queryrequests use an HTTP client with timeout set.timeout = 30# How long the data proxy waits to establish a TCP connection before timingout, default is 10 seconds.dialTimeout = 10# How many seconds the data proxy waits before sending a keepalive request.keep_alive_seconds = 30# How many seconds the data proxy waits for a successful TLS Handshakebefore timing out.tls_handshake_timeout_seconds = 10# How many seconds the data proxy will wait for a server's first responseheaders after# fully writing the request headers if the request has an "Expect:100-continue"# header. A value of 0 will result in the body being sent immediately,without# waiting for the server to approve.expect_continue_timeout_seconds = 1# Optionally limits the total number of connections per host, includingconnections in the dialing,# active, and idle states. On limit violation, dials will block.# A value of zero (0) means no limit.max_conns_per_host = 0# The maximum number of idle connections that Grafana will keep alive.max_idle_connections = 100# How many seconds the data proxy keeps an idle connection open beforetiming out.idle_conn_timeout_seconds = 90# If enabled and user is not anonymous, data proxy will add X-Grafana-Userheader with username into the request.send_user_header = false# Limit the amount of bytes that will be read/accepted from responses ofoutgoing HTTP requests.response_limit = 0# Limits the number of rows that Grafana will process from SQL data sources.row_limit = 1000000#################################### Analytics ###########################[analytics]# Server reporting, sends usage counters to stats.grafana.org every 24hours.# No ip addresses are being tracked, only simple counters to track# running instances, dashboard and error counts. It is very helpful to us.# Change this option to false to disable reporting.reporting_enabled = true# The name of the distributor of the Grafana instance. Ex hosted-grafana,grafana-labsreporting_distributor = grafana-labs# Set to false to disable all checks to https://grafana.com# for new versions of grafana. The check is used# in some UI views to notify that a grafana update exists.# This option does not cause any auto updates, nor send any information# only a GET request tohttps://raw.githubusercontent.com/grafana/grafana/main/latest.json to getthe latest version.check_for_updates = true# Set to false to disable all checks to https://grafana.com# for new versions of plugins. The check is used# in some UI views to notify that a plugin update exists.# This option does not cause any auto updates, nor send any information# only a GET request to https://grafana.com to get the latest versions.check_for_plugin_updates = true# Google Analytics universal tracking code, only enabled if you specify anid heregoogle_analytics_ua_id =# Google Tag Manager ID, only enabled if you specify an id heregoogle_tag_manager_id =# Rudderstack write key, enabled only if rudderstack_data_plane_url is alsosetrudderstack_write_key =# Rudderstack data plane url, enabled only if rudderstack_write_key is alsosetrudderstack_data_plane_url =# Rudderstack SDK url, optional, only valid if rudderstack_write_key andrudderstack_data_plane_url is also setrudderstack_sdk_url =# Rudderstack Config url, optional, used by Rudderstack SDK to fetch sourceconfigrudderstack_config_url =# Application Insights connection string. Specify an URL string to enablethis feature.application_insights_connection_string =# Optional. Specifies an Application Insights endpoint URL where theendpoint string is wrapped in backticks ``.application_insights_endpoint_url =#################################### Security ############################[security]# disable creation of admin user on first start of grafanadisable_initial_admin_creation = false# default admin user, created on startupadmin_user = admin# default admin password, can be changed before first start of grafana, orin profile settingsadmin_password = admin# used for signingsecret_key = SW2YcwTIb9zpOOhoPsMm# current key provider used for envelope encryption, default to static valuespecified by secret_keyencryption_provider = secretKey.v1# list of configured key providers, space separated (Enterprise only): e.g.,awskms.v1 azurekv.v1available_encryption_providers =# disable gravatar profile imagesdisable_gravatar = false# data source proxy whitelist (ip_or_domain:port separated by spaces)data_source_proxy_whitelist =# disable protection against brute force login attemptsdisable_brute_force_login_protection = false# set to true if you host Grafana behind HTTPS. default is false.cookie_secure = false# set cookie SameSite attribute. defaults to `lax`. can be set to "lax","strict", "none" and "disabled"cookie_samesite = lax# set to true if you want to allow browsers to render Grafana in a <frame>,<iframe>, <embed> or <object>. default is false.allow_embedding = true# Set to true if you want to enable http strict transport security (HSTS)response header.# HSTS tells browsers that the site should only be accessed using HTTPS.strict_transport_security = false# Sets how long a browser should cache HSTS. Only applied ifstrict_transport_security is enabled.strict_transport_security_max_age_seconds = 86400# Set to true if to enable HSTS preloading option. Only applied ifstrict_transport_security is enabled.strict_transport_security_preload = false# Set to true if to enable the HSTS includeSubDomains option. Only appliedif strict_transport_security is enabled.strict_transport_security_subdomains = false# Set to true to enable the X-Content-Type-Options response header.# The X-Content-Type-Options response HTTP header is a marker used by theserver to indicate that the MIME types advertised# in the Content-Type headers should not be changed and be followed.x_content_type_options = true# Set to true to enable the X-XSS-Protection header, which tells browsers tostop pages from loading# when they detect reflected cross-site scripting (XSS) attacks.x_xss_protection = true# Enable adding the Content-Security-Policy header to your requests.# CSP allows to control resources the user agent is allowed to load andhelps prevent XSS attacks.content_security_policy = false# Set Content Security Policy template used when adding theContent-Security-Policy header to your requests.# $NONCE in the template includes a random nonce.# $ROOT_PATH is server.root_url without the protocol.content_security_policy_template = """script-src 'self' 'unsafe-eval''unsafe-inline' 'strict-dynamic' $NONCE;object-src 'none';font-src'self';style-src 'self' 'unsafe-inline' blob:;img-src * data:;base-uri'self';connect-src 'self' grafana.com ws://$ROOT_PATHwss://$ROOT_PATH;manifest-src 'self';media-src 'none';form-action 'self';"""# Controls if old angular plugins are supported or not. This will bedisabled by default in Grafana v9.angular_support_enabled = true[security.encryption]# Defines the time-to-live (TTL) for decrypted data encryption keys storedin memory (cache).# Please note that small values may cause performance issues due to a highfrequency decryption operations.data_keys_cache_ttl = 15m# Defines the frequency of data encryption keys cache cleanup interval.# On every interval, decrypted data encryption keys that reached the TTL areremoved from the cache.data_keys_cache_cleanup_interval = 1m#################################### Snapshots ###########################[snapshots]# snapshot sharing optionsexternal_enabled = trueexternal_snapshot_url = https://snapshots.raintank.ioexternal_snapshot_name = Publish to snapshots.raintank.io# Set to true to enable this Grafana instance act as an external snapshotserver and allow unauthenticated requests for# creating and deleting snapshots.public_mode = false# remove expired snapshotsnapshot_remove_expired = true#################################### Dashboards ##################[dashboards]# Number dashboard versions to keep (per dashboard). Default: 20, Minimum: 1versions_to_keep = 20# Minimum dashboard refresh interval. When set, this will restrict users toset the refresh interval of a dashboard lower than given interval. Perdefault this is 5 seconds.# The interval string is a possibly signed sequence of decimal numbers,followed by a unit suffix (ms, s, m, h, d), e.g. 30s or 1m.min_refresh_interval = 5s# Path to the default home dashboard. If this value is empty, then Grafanauses StaticRootPath + "dashboards/home.json"default_home_dashboard_path =################################### Data sources #########################[datasources]# Upper limit of data sources that Grafana will return. This limit is atemporary configuration and it will be deprecated when pagination will beintroduced on the list data sources API.datasource_limit = 5000#################################### Users ###############################[users]# disable user signup / registrationallow_sign_up = false# Allow non admin users to create organizationsallow_org_create = false# Set to true to automatically assign new users to the default organization(id 1)auto_assign_org = true# Set this value to automatically add new users to the provided organization(if auto_assign_org above is set to true)auto_assign_org_id = 1# Default role new users will be automatically assigned (if auto_assign_orgabove is set to true)auto_assign_org_role = Viewer# Require email validation before sign up completesverify_email_enabled = false# Background text for the user field on the login pagelogin_hint = email or usernamepassword_hint = password# Default UI theme ("dark" or "light")default_theme = dark# Path to a custom home page. Users are only redirected to this if thedefault home dashboard is used. It should match a frontend route and containa leading slash.home_page =# External user managementexternal_manage_link_url =external_manage_link_name =external_manage_info =# Viewers can edit/inspect dashboard settings in the browser. But not savethe dashboard.viewers_can_edit = false# Editors can administrate dashboard, folders and teams they createeditors_can_admin = false# The duration in time a user invitation remains valid before expiring. Thissetting should be expressed as a duration. Examples: 6h (hours), 2d (days),1w (week). Default is 24h (24 hours). The minimum supported duration is 15m(15 minutes).user_invite_max_lifetime_duration = 24h# Enter a comma-separated list of usernames to hide them in the Grafana UI.These users are shown to Grafana admins and to themselves.hidden_users =[auth]# Login cookie namelogin_cookie_name = grafana_session# The maximum lifetime (duration) an authenticated user can be inactivebefore being required to login at next visit. Default is 7 days (7d). Thissetting should be expressed as a duration, e.g. 5m (minutes), 6h (hours),10d (days), 2w (weeks), 1M (month). The lifetime resets at each successfultoken rotation (token_rotation_interval_minutes).login_maximum_inactive_lifetime_duration =# The maximum lifetime (duration) an authenticated user can be logged insince login time before being required to login. Default is 30 days (30d).This setting should be expressed as a duration, e.g. 5m (minutes), 6h(hours), 10d (days), 2w (weeks), 1M (month).login_maximum_lifetime_duration =# How often should auth tokens be rotated for authenticated users when beingactive. The default is each 10 minutes.token_rotation_interval_minutes = 10# Set to true to disable (hide) the login form, useful if you use OAuthdisable_login_form = false# Set to true to disable the sign out link in the side menu. Useful if youuse auth.proxy or auth.jwt.disable_signout_menu = false# URL to redirect the user to after sign outsignout_redirect_url =# Set to true to attempt login with OAuth automatically, skipping the loginscreen.# This setting is ignored if multiple OAuth providers are configured.oauth_auto_login = false# OAuth state max age cookie duration in seconds. Defaults to 600 seconds.oauth_state_cookie_max_age = 600# Skip forced assignment of OrgID 1 or 'auto_assign_org_id' for socialloginsoauth_skip_org_role_update_sync = false# limit of api_key seconds to live before expirationapi_key_max_seconds_to_live = -1# Set to true to enable SigV4 authentication option for HTTP-baseddatasourcessigv4_auth_enabled = false# Set to true to enable verbose logging of SigV4 request signingsigv4_verbose_logging = false#################################### Anonymous Auth ######################[auth.anonymous]# enable anonymous accessenabled = true# specify organization name that should be used for unauthenticated usersorg_name = Main Org.# specify role for unauthenticated usersorg_role = Viewer# mask the Grafana version number for unauthenticated usershide_version = false#################################### GitHub Auth #########################[auth.github]enabled = falseallow_sign_up = trueclient_id = some_idclient_secret =scopes = user:email,read:orgauth_url = https://github.com/login/oauth/authorizetoken_url = https://github.com/login/oauth/access_tokenapi_url = https://api.github.com/userallowed_domains =team_ids =allowed_organizations =#################################### GitLab Auth #########################[auth.gitlab]enabled = falseallow_sign_up = trueclient_id = some_idclient_secret =scopes = apiauth_url = https://gitlab.com/oauth/authorizetoken_url = https://gitlab.com/oauth/tokenapi_url = https://gitlab.com/api/v4allowed_domains =allowed_groups =#################################### Google Auth #########################[auth.google]enabled = falseallow_sign_up = trueclient_id = some_client_idclient_secret =scopes = https://www.googleapis.com/auth/userinfo.profilehttps://www.googleapis.com/auth/userinfo.emailauth_url = https://accounts.google.com/o/oauth2/authtoken_url = https://accounts.google.com/o/oauth2/tokenapi_url = https://www.googleapis.com/oauth2/v1/userinfoallowed_domains =hosted_domain =#################################### Grafana.com Auth ##################### legacy key names (so they work in env variables)[auth.grafananet]enabled = falseallow_sign_up = trueclient_id = some_idclient_secret =scopes = user:emailallowed_organizations =[auth.grafana_com]enabled = falseallow_sign_up = trueclient_id = some_idclient_secret =scopes = user:emailallowed_organizations =#################################### Azure AD OAuth #######################[auth.azuread]name = Azure ADenabled = falseallow_sign_up = trueclient_id = some_client_idclient_secret =scopes = openid email profileauth_url =https://login.microsoftonline.com/<tenant-id>/oauth2/v2.0/authorizetoken_url = https://login.microsoftonline.com/<tenant-id>/oauth2/v2.0/tokenallowed_domains =allowed_groups =role_attribute_strict = false#################################### Okta OAuth #######################[auth.okta]name = Oktaicon = oktaenabled = falseallow_sign_up = trueclient_id = some_idclient_secret =scopes = openid profile email groupsauth_url = https://<tenant-id>.okta.com/oauth2/v1/authorizetoken_url = https://<tenant-id>.okta.com/oauth2/v1/tokenapi_url = https://<tenant-id>.okta.com/oauth2/v1/userinfoallowed_domains =allowed_groups =role_attribute_path =role_attribute_strict = false#################################### Generic OAuth #######################[auth.generic_oauth]name = OAuthicon = signinenabled = falseallow_sign_up = trueclient_id = some_idclient_secret =scopes = user:emailempty_scopes = falseemail_attribute_name = email:primaryemail_attribute_path =login_attribute_path =name_attribute_path =role_attribute_path =role_attribute_strict = falsegroups_attribute_path =id_token_attribute_name =team_ids_attribute_path =auth_url =token_url =api_url =teams_url =allowed_domains =team_ids =allowed_organizations =tls_skip_verify_insecure = falsetls_client_cert =tls_client_key =tls_client_ca =use_pkce = false#################################### Basic Auth ##########################[auth.basic]enabled = true#################################### Auth Proxy ##########################[auth.proxy]enabled = falseheader_name = X-WEBAUTH-USERheader_property = usernameauto_sign_up = true# Deprecated, use sync_ttl insteadldap_sync_ttl = 60sync_ttl = 60whitelist =headers =headers_encoded = falseenable_login_token = false#################################### Auth JWT ##########################[auth.jwt]enabled = falseheader_name =email_claim =username_claim =jwk_set_url =jwk_set_file =cache_ttl = 60mexpected_claims = {}key_file =auto_sign_up = false#################################### Auth LDAP ###########################[auth.ldap]enabled = falseconfig_file = /etc/grafana/ldap.tomlallow_sign_up = true# LDAP background sync (Enterprise only)# At 1 am every daysync_cron = "0 0 1 * * *"active_sync_enabled = true#################################### AWS ###########################[aws]# Enter a comma-separated list of allowed AWS authentication providers.# Options are: default (AWS SDK Default), keys (Access && secret key),credentials (Credentials field), ec2_iam_role (EC2 IAM Role)allowed_auth_providers = default,keys,credentials# Allow AWS users to assume a role using temporary security credentials.# If true, assume role will be enabled for all AWS authentication providersthat are specified in aws_auth_providersassume_role_enabled = true# Specify max no of pages to be returned by the ListMetricPages APIlist_metrics_page_limit = 500#################################### Azure ###############################[azure]# Azure cloud environment where Grafana is hosted# Possible values are AzureCloud, AzureChinaCloud, AzureUSGovernment andAzureGermanCloud# Default value is AzureCloud (i.e. public cloud)cloud = AzureCloud# Specifies whether Grafana hosted in Azure service with Managed Identityconfigured (e.g. Azure Virtual Machines instance)# If enabled, the managed identity can be used for authentication of Grafanain Azure services# Disabled by default, needs to be explicitly enabledmanaged_identity_enabled = false# Client ID to use for user-assigned managed identity# Should be set for user-assigned identity and should be empty forsystem-assigned identitymanaged_identity_client_id =#################################### SMTP / Emailing #####################[smtp]enabled = falsehost = localhost:25user =# If the password contains # or ; you have to wrap it with triple quotes. Ex"""#password;"""password =cert_file =key_file =skip_verify = falsefrom_address = admin@grafana.localhostfrom_name = Grafanaehlo_identity =startTLS_policy =[emails]welcome_email_on_sign_up = falsetemplates_pattern = emails/*.html, emails/*.txtcontent_types = text/html#################################### Logging ##########################[log]# Either "console", "file", "syslog". Default is console and file# Use space to separate multiple modes, e.g. "console file"mode = console file# Either "debug", "info", "warn", "error", "critical", default is "info"level = info# optional settings to set different levels for specific loggers. Ex filters= sqlstore:debugfilters =# For "console" mode only[log.console]level =# log line format, valid options are text, console and jsonformat = console# For "file" mode only[log.file]level =# log line format, valid options are text, console and jsonformat = text# This enables automated log rotate(switch of following options), default istruelog_rotate = true# Max line number of single file, default is 1000000max_lines = 1000000# Max size shift of single file, default is 28 means 1 << 28, 256MBmax_size_shift = 28# Segment log daily, default is truedaily_rotate = true# Expired days of log file(delete after max days), default is 7max_days = 7[log.syslog]level =# log line format, valid options are text, console and jsonformat = text# Syslog network type and address. This can be udp, tcp, or unix. If leftblank, the default unix endpoints will be used.network =address =# Syslog facility. user, daemon and local0 through local7 are valid.facility =# Syslog tag. By default, the process' argv[0] is used.tag =[log.frontend]# Should Sentry javascript agent be initializedenabled = false# Sentry DSN if you want to send events to Sentry.sentry_dsn =# Custom HTTP endpoint to send events captured by the Sentry agent to.Default will log the events to stdout.custom_endpoint = /log# Rate of events to be reported between 0 (none) and 1 (all), floatsample_rate = 1.0# Requests per second limit enforced per an extended period, for Grafanabackend log ingestion endpoint (/log).log_endpoint_requests_per_second_limit = 3# Max requests accepted per short interval of time for Grafana backend logingestion endpoint (/log)log_endpoint_burst_limit = 15#################################### Usage Quotas ########################[quota]enabled = false#### set quotas to -1 to make unlimited. ##### limit number of users per Org.org_user = 10# limit number of dashboards per Org.org_dashboard = 100# limit number of data_sources per Org.org_data_source = 10# limit number of api_keys per Org.org_api_key = 10# limit number of alerts per Org.org_alert_rule = 100# limit number of orgs a user can create.user_org = 10# Global limit of users.global_user = -1# global limit of orgs.global_org = -1# global limit of dashboardsglobal_dashboard = -1# global limit of api_keysglobal_api_key = -1# global limit on number of logged in users.global_session = -1# global limit of alertsglobal_alert_rule = -1#################################### Unified Alerting ####################[unified_alerting]# Enable the Unified Alerting sub-system and interface. When enabled we'llmigrate all of your alert rules and notification channels to the new system.New alert rules will be created and your notification channels will beconverted into an Alertmanager configuration. Previous data is preserved toenable backwards compatibility but new data is removed when switching. Whenthis configuration section and flag are not defined, the state is defined atruntime. See the documentation for more details.enabled =# Comma-separated list of organization IDs for which to disable unifiedalerting. Only supported if unified alerting is enabled.disabled_orgs =# Specify the frequency of polling for admin config changes.# The interval string is a possibly signed sequence of decimal numbers,followed by a unit suffix (ms, s, m, h, d), e.g. 30s or 1m.admin_config_poll_interval = 60s# Specify the frequency of polling for Alertmanager config changes.# The interval string is a possibly signed sequence of decimal numbers,followed by a unit suffix (ms, s, m, h, d), e.g. 30s or 1m.alertmanager_config_poll_interval = 60s# Listen address/hostname and port to receive unified alerting messages forother Grafana instances. The port is used for both TCP and UDP. It isassumed other Grafana instances are also running on the same port.ha_listen_address = "0.0.0.0:9094"# Explicit address/hostname and port to advertise other Grafana instances.The port is used for both TCP and UDP.ha_advertise_address = ""# Comma-separated list of initial instances (in a format of host:port) thatwill form the HA cluster. Configuring this setting will enable HighAvailability mode for alerting.ha_peers = ""# Time to wait for an instance to send a notification via the Alertmanager.In HA, each Grafana instance will# be assigned a position (e.g. 0, 1). We then multiply this position withthe timeout to indicate how long should# each instance wait before sending the notification to take into accountreplication lag.# The interval string is a possibly signed sequence of decimal numbers,followed by a unit suffix (ms, s, m, h, d), e.g. 30s or 1m.ha_peer_timeout = 15s# The interval between sending gossip messages. By lowering this value (morefrequent) gossip messages are propagated# across cluster more quickly at the expense of increased bandwidth usage.# The interval string is a possibly signed sequence of decimal numbers,followed by a unit suffix (ms, s, m, h, d), e.g. 30s or 1m.ha_gossip_interval = 200ms# The interval between gossip full state syncs. Setting this interval lower(more frequent) will increase convergence speeds# across larger clusters at the expense of increased bandwidth usage.# The interval string is a possibly signed sequence of decimal numbers,followed by a unit suffix (ms, s, m, h, d), e.g. 30s or 1m.ha_push_pull_interval = 60s# Enable or disable alerting rule execution. The alerting UI remainsvisible. This option has a legacy version in the `[alerting]` section thattakes precedence.execute_alerts = true# Alert evaluation timeout when fetching data from the datasource. Thisoption has a legacy version in the `[alerting]` section that takesprecedence.# The timeout string is a possibly signed sequence of decimal numbers,followed by a unit suffix (ms, s, m, h, d), e.g. 30s or 1m.evaluation_timeout = 30s# Number of times we'll attempt to evaluate an alert rule before giving upon that evaluation. This option has a legacy version in the `[alerting]`section that takes precedence.max_attempts = 3# Minimum interval to enforce between rule evaluations. Rules will beadjusted if they are less than this value or if they are not multiple of thescheduler interval (10s). Higher values can help with resource management aswe'll schedule fewer evaluations over time. This option has a legacy versionin the `[alerting]` section that takes precedence.# The interval string is a possibly signed sequence of decimal numbers,followed by a unit suffix (ms, s, m, h, d), e.g. 30s or 1m.min_interval = 10s#################################### Alerting ############################[alerting]# Enable the legacy alerting sub-system and interface. If Unified Alertingis already enabled and you try to go back to legacy alerting, all data thatis part of Unified Alerting will be deleted. When this configuration sectionand flag are not defined, the state is defined at runtime. See thedocumentation for more details.enabled =# Makes it possible to turn off alert execution but alerting UI is visibleexecute_alerts = true# Default setting for new alert rules. Defaults to categorize error andtimeouts as alerting. (alerting, keep_state)error_or_timeout = alerting# Default setting for how Grafana handles nodata or null values in alerting.(alerting, no_data, keep_state, ok)nodata_or_nullvalues = no_data# Alert notifications can include images, but rendering many images at thesame time can overload the server# This limit will protect the server from render overloading and make surenotifications are sent out quicklyconcurrent_render_limit = 5# Default setting for alert calculation timeout. Default value is 30evaluation_timeout_seconds = 30# Default setting for alert notification timeout. Default value is 30notification_timeout_seconds = 30# Default setting for max attempts to sending alert notifications. Defaultvalue is 3max_attempts = 3# Makes it possible to enforce a minimal interval between evaluations, toreduce load on the backendmin_interval_seconds = 1# Configures for how long alert annotations are stored. Default is 0, whichkeeps them forever.# This setting should be expressed as an duration. Ex 6h (hours), 10d(days), 2w (weeks), 1M (month).max_annotation_age =# Configures max number of alert annotations that Grafana stores. Defaultvalue is 0, which keeps all alert annotations.max_annotations_to_keep =#################################### Annotations #########################[annotations]# Configures the batch size for the annotation clean-up job. This setting isused for dashboard, API, and alert annotations.cleanupjob_batchsize = 100[annotations.dashboard]# Dashboard annotations means that annotations are associated with thedashboard they are created on.# Configures how long dashboard annotations are stored. Default is 0, whichkeeps them forever.# This setting should be expressed as a duration. Examples: 6h (hours), 10d(days), 2w (weeks), 1M (month).max_age =# Configures max number of dashboard annotations that Grafana stores.Default value is 0, which keeps all dashboard annotations.max_annotations_to_keep =[annotations.api]# API annotations means that the annotations have been created using the APIwithout any# association with a dashboard.# Configures how long Grafana stores API annotations. Default is 0, whichkeeps them forever.# This setting should be expressed as a duration. Examples: 6h (hours), 10d(days), 2w (weeks), 1M (month).max_age =# Configures max number of API annotations that Grafana keeps. Default valueis 0, which keeps all API annotations.max_annotations_to_keep =#################################### Explore #############################[explore]# Enable the Explore sectionenabled = true#################################### Help #############################[help]# Enable the Help sectionenabled = true#################################### Profile #############################[profile]# Enable the Profile sectionenabled = true#################################### Query History#############################[query_history]# Enable the Query historyenabled = false#################################### Internal Grafana Metrics ############# Metrics available at HTTP URL /metrics and /metrics/plugins/:pluginId[metrics]enabled              = trueinterval_seconds     = 10# Disable total stats (stat_totals_*) metrics to be generateddisable_total_stats = false#If both are set, basic auth will be required for the metrics endpoints.basic_auth_username =basic_auth_password =# Metrics environment info adds dimensions to the `grafana_environment_info`metric, which# can expose more information about the Grafana instance.[metrics.environment_info]#exampleLabel1 = exampleValue1#exampleLabel2 = exampleValue2# Send internal Grafana metrics to graphite[metrics.graphite]# Enable by setting the address setting (ex localhost:2003)address =prefix = prod.grafana.%(instance_name)s.#################################### Grafana.com integration ##########################[grafana_net]url = https://grafana.com[grafana_com]url = https://grafana.com#################################### Distributed tracing ############[tracing.jaeger]# jaeger destination (ex localhost:6831)address =# tag that will always be included in when creating new spans. ex(tag1:value1,tag2:value2)always_included_tag =# Type specifies the type of the sampler: const, probabilistic,rateLimiting, or remotesampler_type = const# jaeger samplerconfig param# for "const" sampler, 0 or 1 for always false/true respectively# for "probabilistic" sampler, a probability between 0 and 1# for "rateLimiting" sampler, the number of spans per second# for "remote" sampler, param is the same as for "probabilistic"# and indicates the initial sampling rate before the actual one# is received from the mothershipsampler_param = 1# sampling_server_url is the URL of a sampling manager providing a samplingstrategy.sampling_server_url =# Whether or not to use Zipkin span propagation (x-b3- HTTP headers).zipkin_propagation = false# Setting this to true disables shared RPC spans.# Not disabling is the most common setting when using Zipkin elsewhere inyour infrastructure.disable_shared_zipkin_spans = false[tracing.opentelemetry.jaeger]# jaeger destination (ex http://localhost:14268/api/traces)address =#################################### External Image Storage ##############[external_image_storage]# Used for uploading images to public servers so they can be included inslack/email messages.# You can choose between (s3, webdav, gcs, azure_blob, local)provider =[external_image_storage.s3]endpoint =path_style_access =bucket_url =bucket =region =path =access_key =secret_key =[external_image_storage.webdav]url =username =password =public_url =[external_image_storage.gcs]key_file =bucket =path =enable_signed_urls = falsesigned_url_expiration =[external_image_storage.azure_blob]account_name =account_key =container_name =[external_image_storage.local]# does not require any configuration[rendering]# Options to configure a remote HTTP image rendering service, e.g. usinghttps://github.com/grafana/grafana-image-renderer.# URL to a remote HTTP image renderer service, e.g.http://localhost:8081/render, will enable Grafana to render panels anddashboards to PNG-images using HTTP requests to an external service.server_url =# If the remote HTTP image renderer service runs on a different server thanthe Grafana server you may have to configure this to a URL where Grafana isreachable, e.g. http://grafana.domain/.callback_url =# Concurrent render request limit affects when the /render HTTP endpoint isused. Rendering many images at the same time can overload the server,# which this setting can help protect against by only allowing a certainamount of concurrent requests.concurrent_render_request_limit = 30[panels]# here for to support old env variables, can remove after a few monthsenable_alpha = falsedisable_sanitize_html = false[plugins]enable_alpha = falseapp_tls_skip_verify_insecure = false# Enter a comma-separated list of plugin identifiers to identify plugins toload even if they are unsigned. Plugins with modified signatures are neverloaded.allow_loading_unsigned_plugins =# Enable or disable installing / uninstalling / updating plugins directlyfrom within Grafana.plugin_admin_enabled = trueplugin_admin_external_manage_enabled = falseplugin_catalog_url = https://grafana.com/grafana/plugins/# Enter a comma-separated list of plugin identifiers to hide in the plugincatalog.plugin_catalog_hidden_plugins =#################################### Grafana Live##########################################[live]# max_connections to Grafana Live WebSocket endpoint per Grafana serverinstance. See Grafana Live docs# if you are planning to make it higher than default 100 since this canrequire some OS and infrastructure# tuning. 0 disables Live, -1 means unlimited connections.max_connections = 100# allowed_origins is a comma-separated list of origins that can establishconnection with Grafana Live.# If not set then origin will be matched over root_url. Supports wildcardsymbol "*".allowed_origins =# engine defines an HA (high availability) engine to use for Grafana Live.By default no engine used - in# this case Live features work only on a single Grafana server.# Available options: "redis".# Setting ha_engine is an EXPERIMENTAL feature.ha_engine =# ha_engine_address sets a connection address for Live HA engine. Dependingon engine type address format can differ.# For now we only support Redis connection address in "host:port" format.# This option is EXPERIMENTAL.ha_engine_address = "127.0.0.1:6379"#################################### Grafana Image Renderer Plugin##########################[plugin.grafana-image-renderer]# Instruct headless browser instance to use a default timezone when notprovided by Grafana, e.g. when rendering panel image of alert.# See ICU’s metaZones.txt(https://cs.chromium.org/chromium/src/third_party/icu/source/data/misc/metaZones.txt)for a list of supported# timezone IDs. Fallbacks to TZ environment variable if not set.rendering_timezone =# Instruct headless browser instance to use a default language when notprovided by Grafana, e.g. when rendering panel image of alert.# Please refer to the HTTP header Accept-Language to understand how toformat this value, e.g. 'fr-CH, fr;q=0.9, en;q=0.8, de;q=0.7, *;q=0.5'.rendering_language =# Instruct headless browser instance to use a default device scale factorwhen not provided by Grafana, e.g. when rendering panel image of alert.# Default is 1. Using a higher value will produce more detailed images(higher DPI), but will require more disk space to store an image.rendering_viewport_device_scale_factor =# Instruct headless browser instance whether to ignore HTTPS errors duringnavigation. Per default HTTPS errors are not ignored. Due to# the security risk it's not recommended to ignore HTTPS errors.rendering_ignore_https_errors =# Instruct headless browser instance whether to capture and log verboseinformation when rendering an image. Default is false and will# only capture and log error messages. When enabled, debug messages arecaptured and logged as well.# For the verbose information to be included in the Grafana server log youhave to adjust the rendering log level to debug, configure# [log].filter = rendering:debug.rendering_verbose_logging =# Instruct headless browser instance whether to output its debug and errormessages into running process of remote rendering service.# Default is false. This can be useful to enable (true) whentroubleshooting.rendering_dumpio =# Additional arguments to pass to the headless browser instance. Default is--no-sandbox. The list of Chromium flags can be found# here (https://peter.sh/experiments/chromium-command-line-switches/).Multiple arguments is separated with comma-character.rendering_args =# You can configure the plugin to use a different browser binary instead ofthe pre-packaged version of Chromium.# Please note that this is not recommended, since you may encounter problemsif the installed version of Chrome/Chromium is not# compatible with the plugin.rendering_chrome_bin =# Instruct how headless browser instances are created. Default is 'default'and will create a new browser instance on each request.# Mode 'clustered' will make sure that only a maximum of browsers/incognitopages can execute concurrently.# Mode 'reusable' will have one browser instance and will create a newincognito page on each request.rendering_mode =# When rendering_mode = clustered, you can instruct how many browsers orincognito pages can execute concurrently. Default is 'browser'# and will cluster using browser instances.# Mode 'context' will cluster using incognito pages.rendering_clustering_mode =# When rendering_mode = clustered, you can define the maximum number ofbrowser instances/incognito pages that can execute concurrently. Default is'5'.rendering_clustering_max_concurrency =# When rendering_mode = clustered, you can specify the duration a renderingrequest can take before it will time out. Default is `30` seconds.rendering_clustering_timeout =# Limit the maximum viewport width, height and device scale factor that canbe requested.rendering_viewport_max_width =rendering_viewport_max_height =rendering_viewport_max_device_scale_factor =# Change the listening host and port of the gRPC server. Default host is127.0.0.1 and default port is 0 and will automatically assign# a port not in use.grpc_host =grpc_port =[enterprise]license_path =[feature_toggles]# there are currently two ways to enable feature toggles in the`grafana.ini`.# you can either pass an array of feature you want to enable to the `enable`field or# configure each toggle by setting the name of the toggle to true/false.Toggles set to true/false# will take precedence over toggles in the `enable` list.# enable = feature1,feature2enable =# The new prometheus visual query builder promQueryBuilder = true# feature1 = true# feature2 = false[date_formats]# For information on what formatting patterns that are supportedhttps://momentjs.com/docs/#/displaying/# Default system date format used in time range picker and other placeswhere full time is displayedfull_date = YYYY-MM-DD HH:mm:ss# Used by graph and other places where we only show small intervalsinterval_second = HH:mm:ssinterval_minute = HH:mminterval_hour = MM/DD HH:mminterval_day = MM/DDinterval_month = YYYY-MMinterval_year = YYYY# Experimental featureuse_browser_locale = false# Default timezone for user preferences. Options are 'browser' for thebrowser local timezone or a timezone name from IANA Time Zone database, e.g.'UTC' or 'Europe/Amsterdam' etc.default_timezone = browser[expressions]# Enable or disable the expressions functionality.enabled = true[geomap]# Set the JSON configuration for the default basemapdefault_baselayer_config =# Enable or disable loading other base map layersenable_custom_baselayers = true
kind: ConfigMap
metadata:name: grafananamespace: grafana---apiVersion: apps/v1
kind: StatefulSet
metadata:name: grafananamespace: grafana
spec:selector:matchLabels:app: grafanaserviceName: grafanatemplate:metadata:labels:app: grafanaspec:containers:- image: 'grafana/grafana:latest'imagePullPolicy: IfNotPresentname: grafanavolumeMounts:- mountPath: /var/lib/grafananame: grafana-datasubPath: grafana- mountPath: /usr/share/grafana/conf/default.ininame: grafana-cmsubPath: default.inivolumes:- configMap:items:- key: default.inipath: default.ininame: grafananame: grafana-cmvolumeClaimTemplates:- apiVersion: v1kind: PersistentVolumeClaimmetadata:name: grafana-dataspec:accessModes:- ReadWriteOnceresources:requests:storage: 1GistorageClassName: managed-nfs-storagevolumeMode: Filesystemstatus:phase: Pending---
apiVersion: v1
kind: Service
metadata:labels:app: grafananame: grafananamespace: grafana
spec:ports:- nodePort: 30007port: 3000protocol: TCPtargetPort: 3000selector:app: grafanatype: NodePort
1.5、配置可视化大屏
1.5.1、登录grafana首页
直接在浏览器上访问grafana,上面为grafana暴露的端口是30007,比如:http://192.168.139.133:30007/
初始用户名和密码如下:
- 用户名:admin
- 密码:admin
输入之后就可以修改密码了,比如我修改的密码是admin123456
然后就可以登录grafana首页了
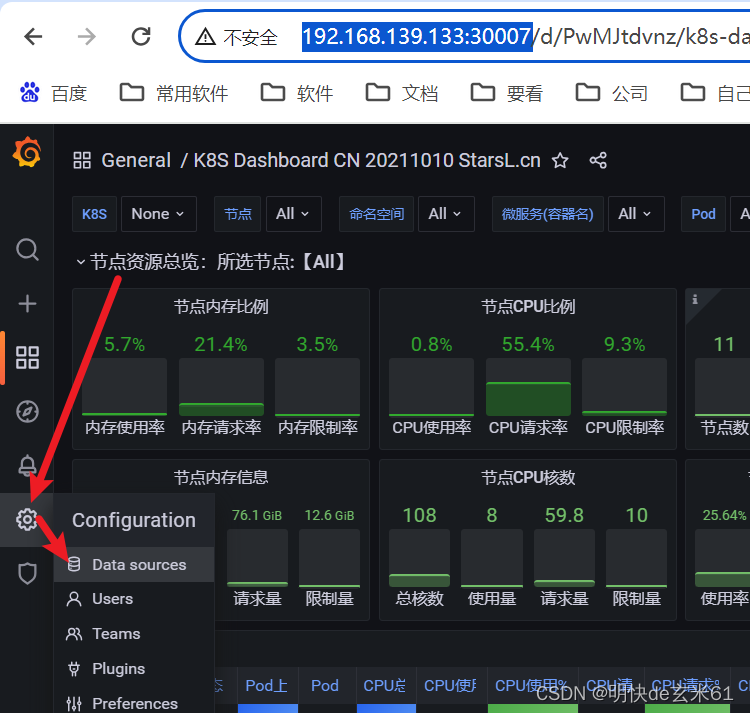
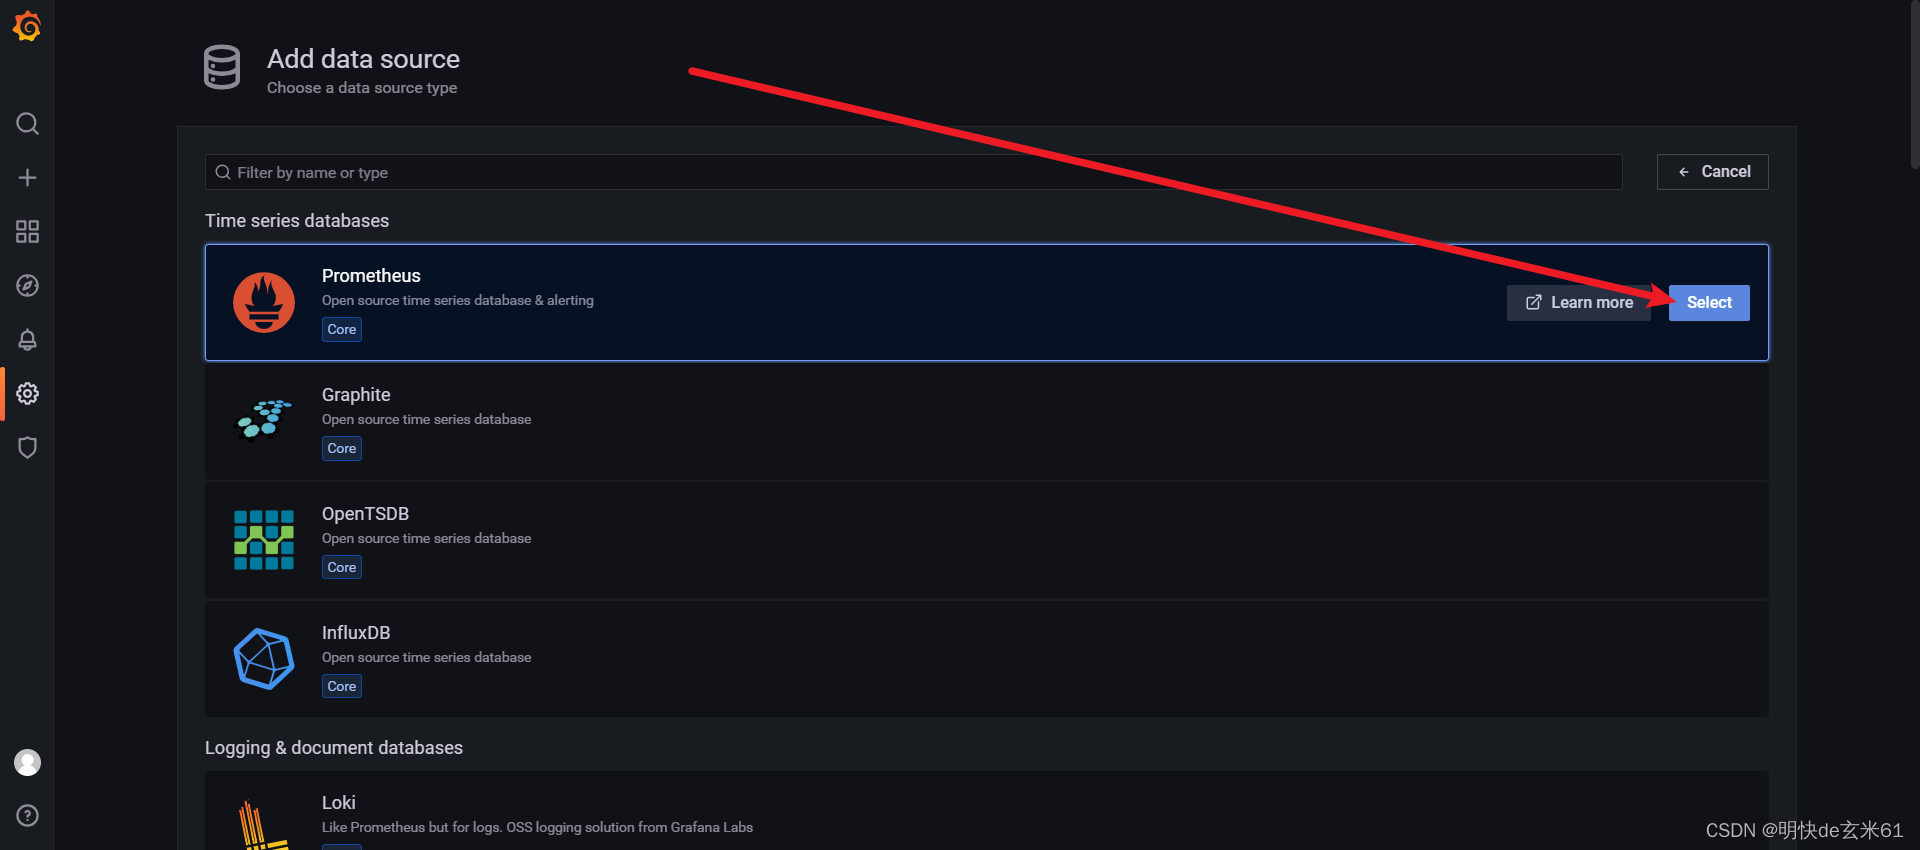
1.5.2、配置prometheus作为数据源
将鼠标移动到左侧设置按钮上,然后在右侧点击Data Sources按钮:
然后选择Prometheus作为数据源:
然后输入数据源名称和数据源地址
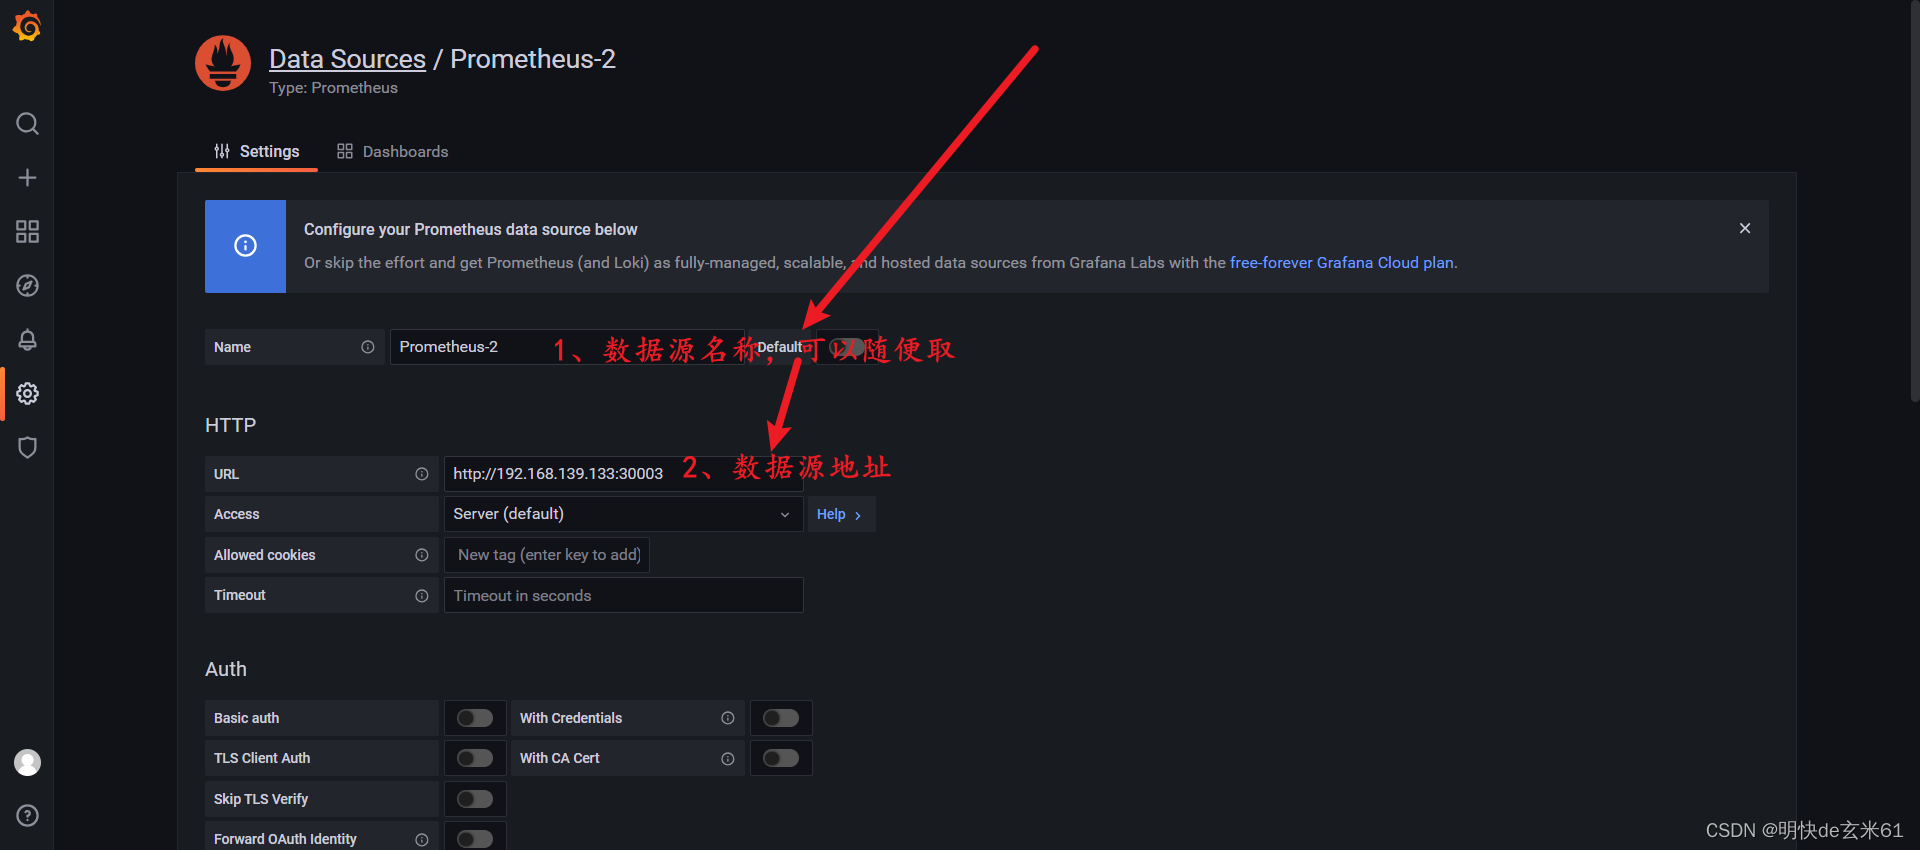
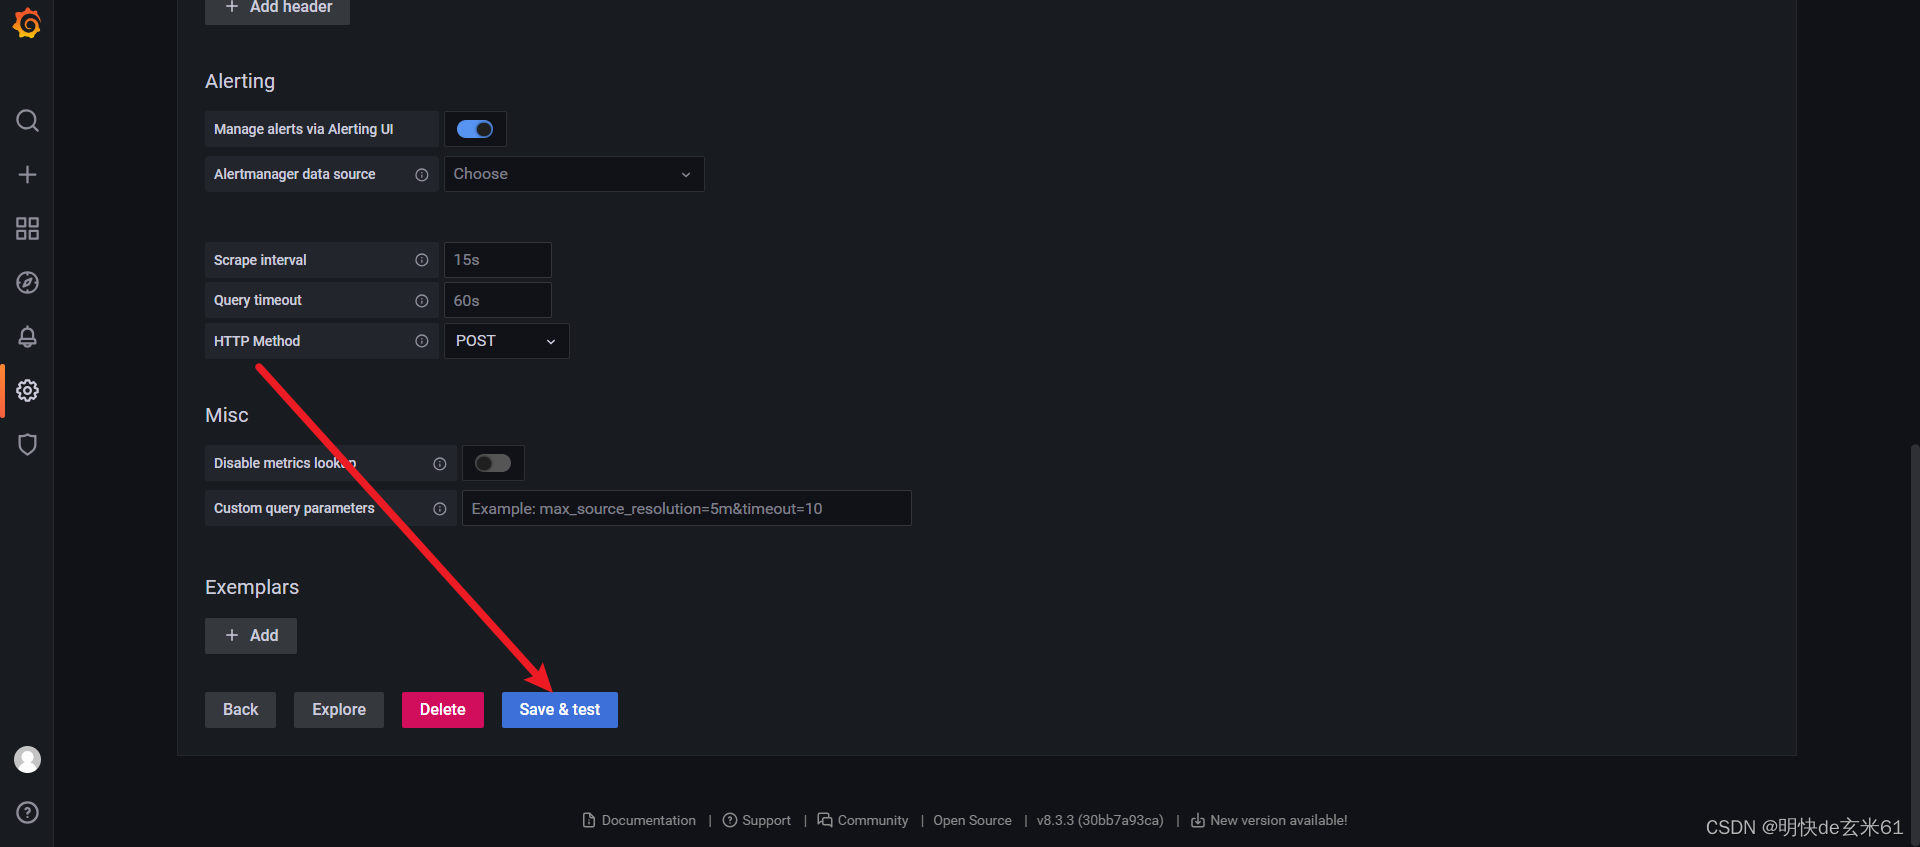
填写完成点击页面最下方的save & test按钮即可
1.5.3、配置可视化大屏
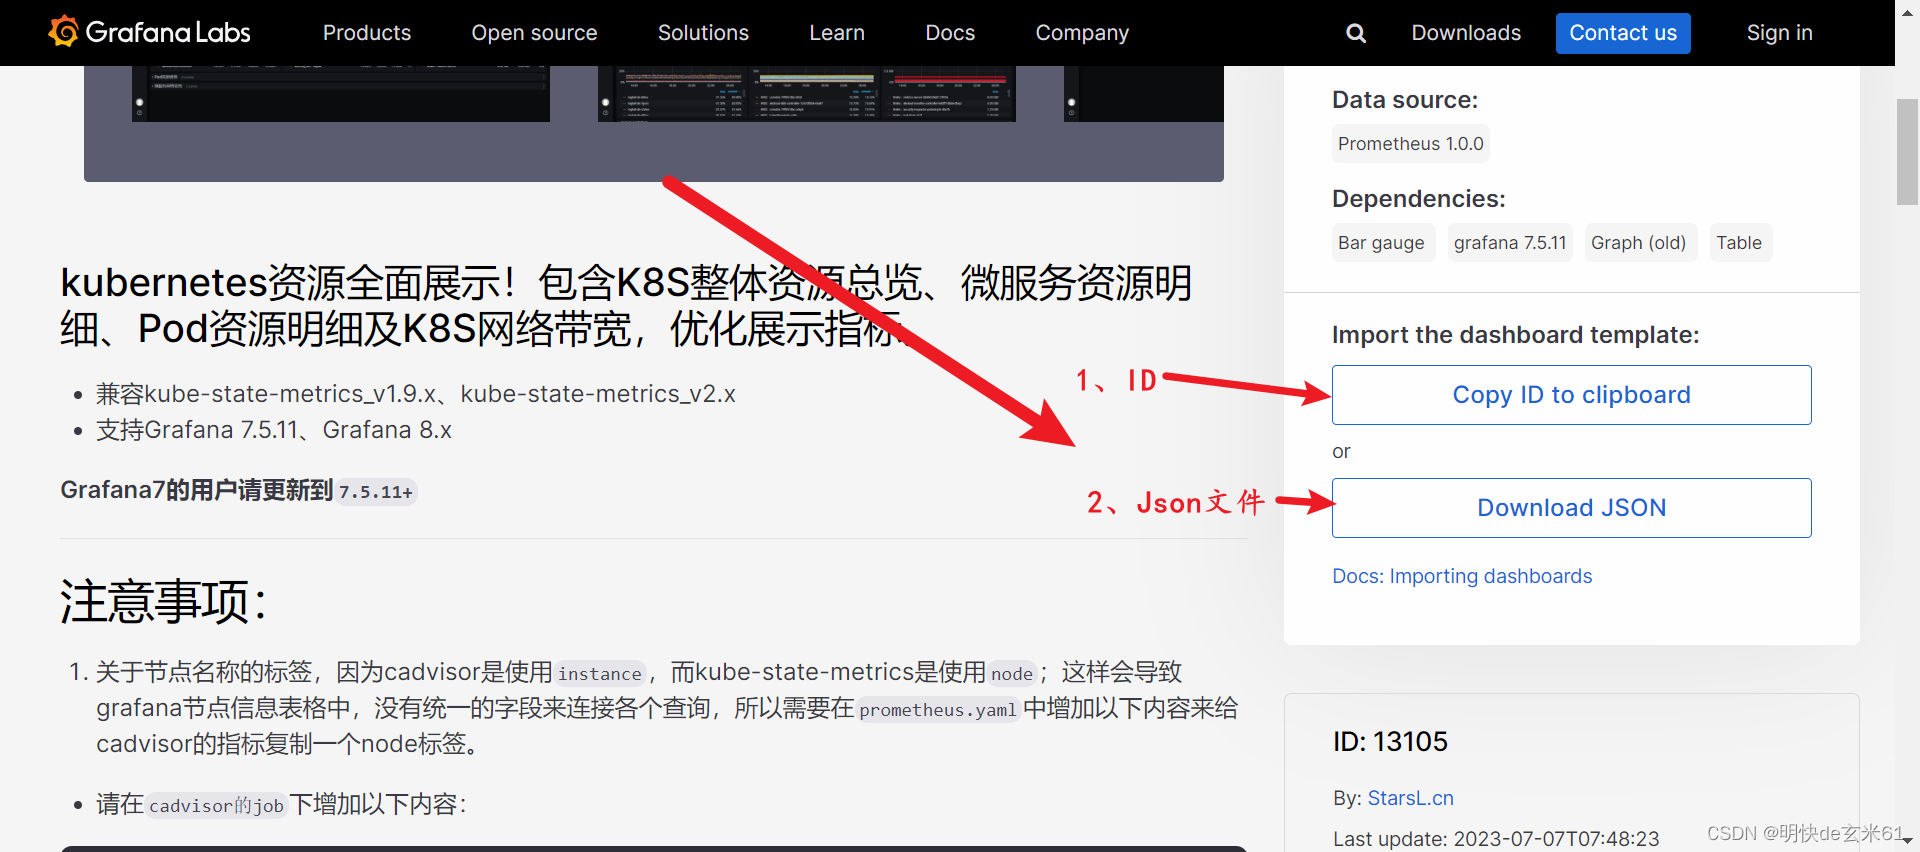
1、查找对应脚本
访问GrafanaLabs,大家可以寻找任何自己想要的内容,本次我选择的是K8S for Prometheus Dashboard 20211010中文版
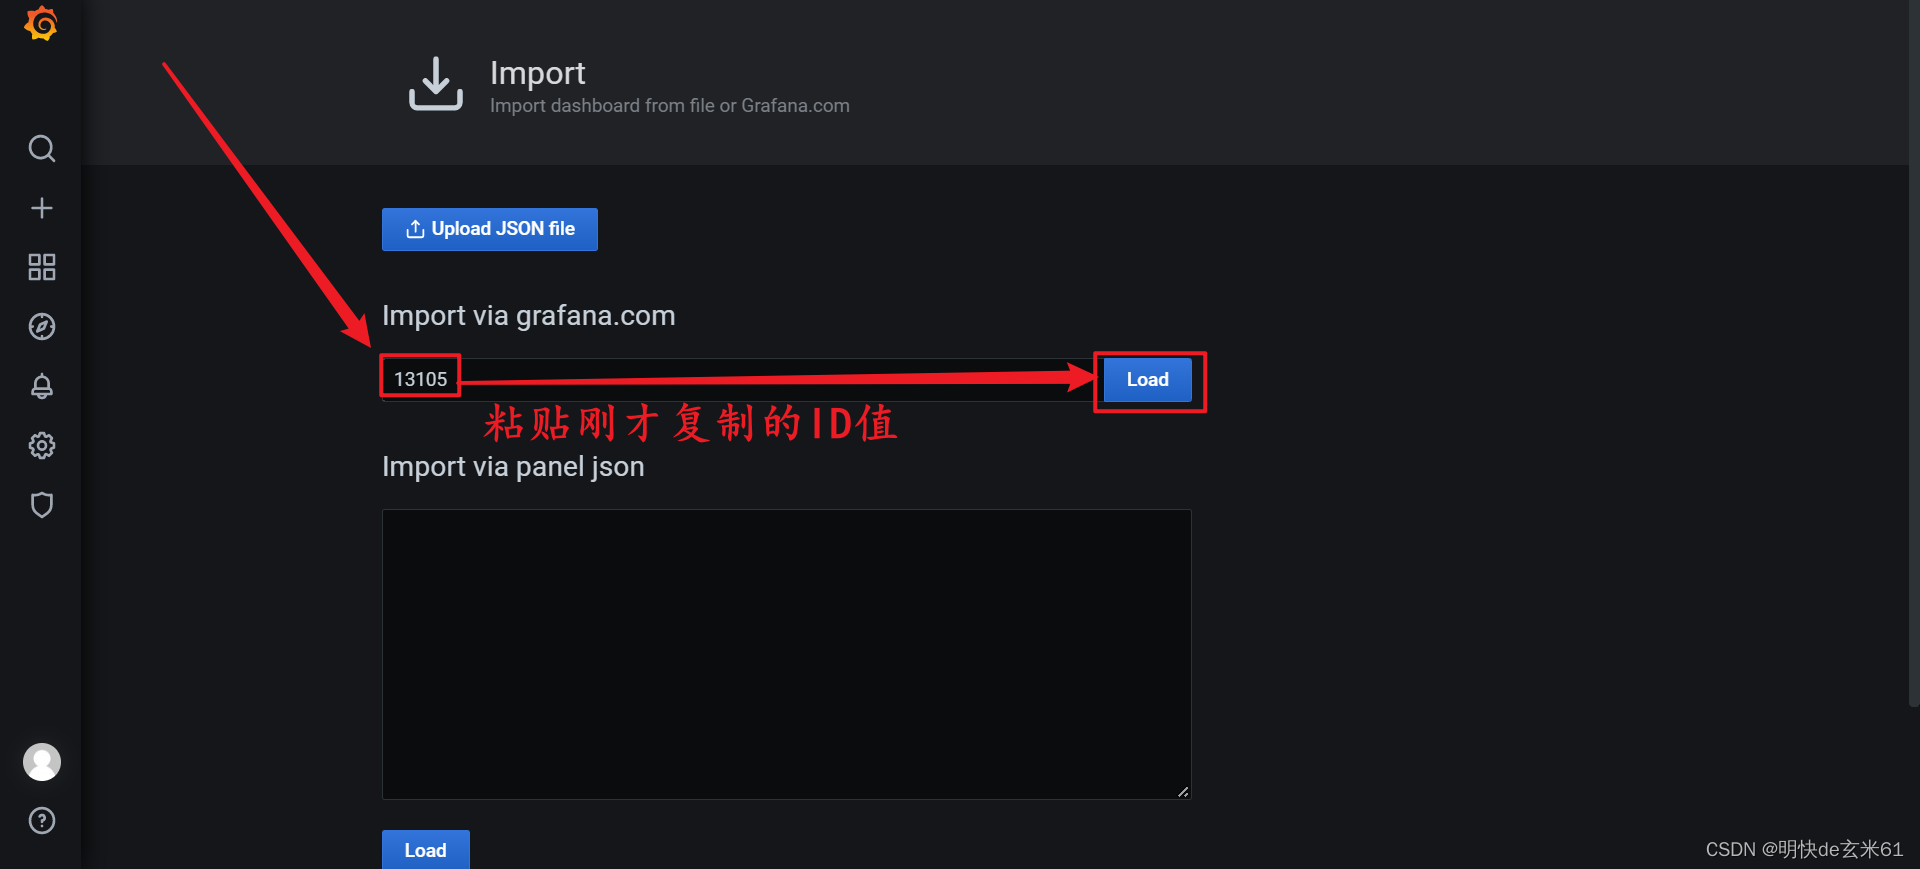
2、复制ID 或者 下载json文件
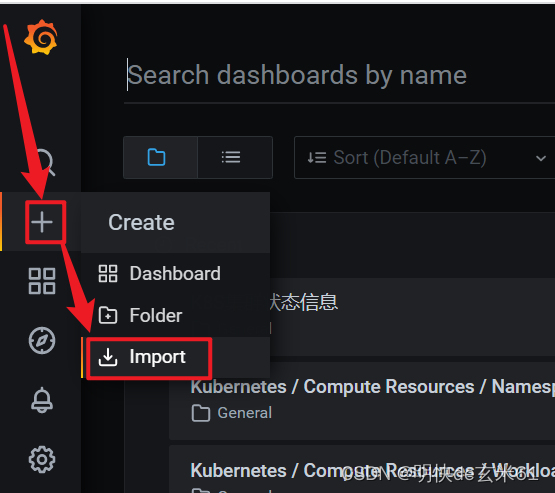
3、在grafana中导入ID或者Json文件的准备工作
如果点击Import之后有弹窗,那么点击第二个按钮就可以了
4、执行添加ID或者导入Json文件操作
首先说添加ID,点击Load按钮,如下:
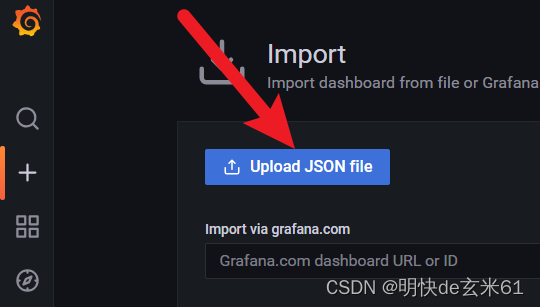
然后说导入Json文件,上面Upload Json file按钮,之后选择下载的Json文件进行导入:
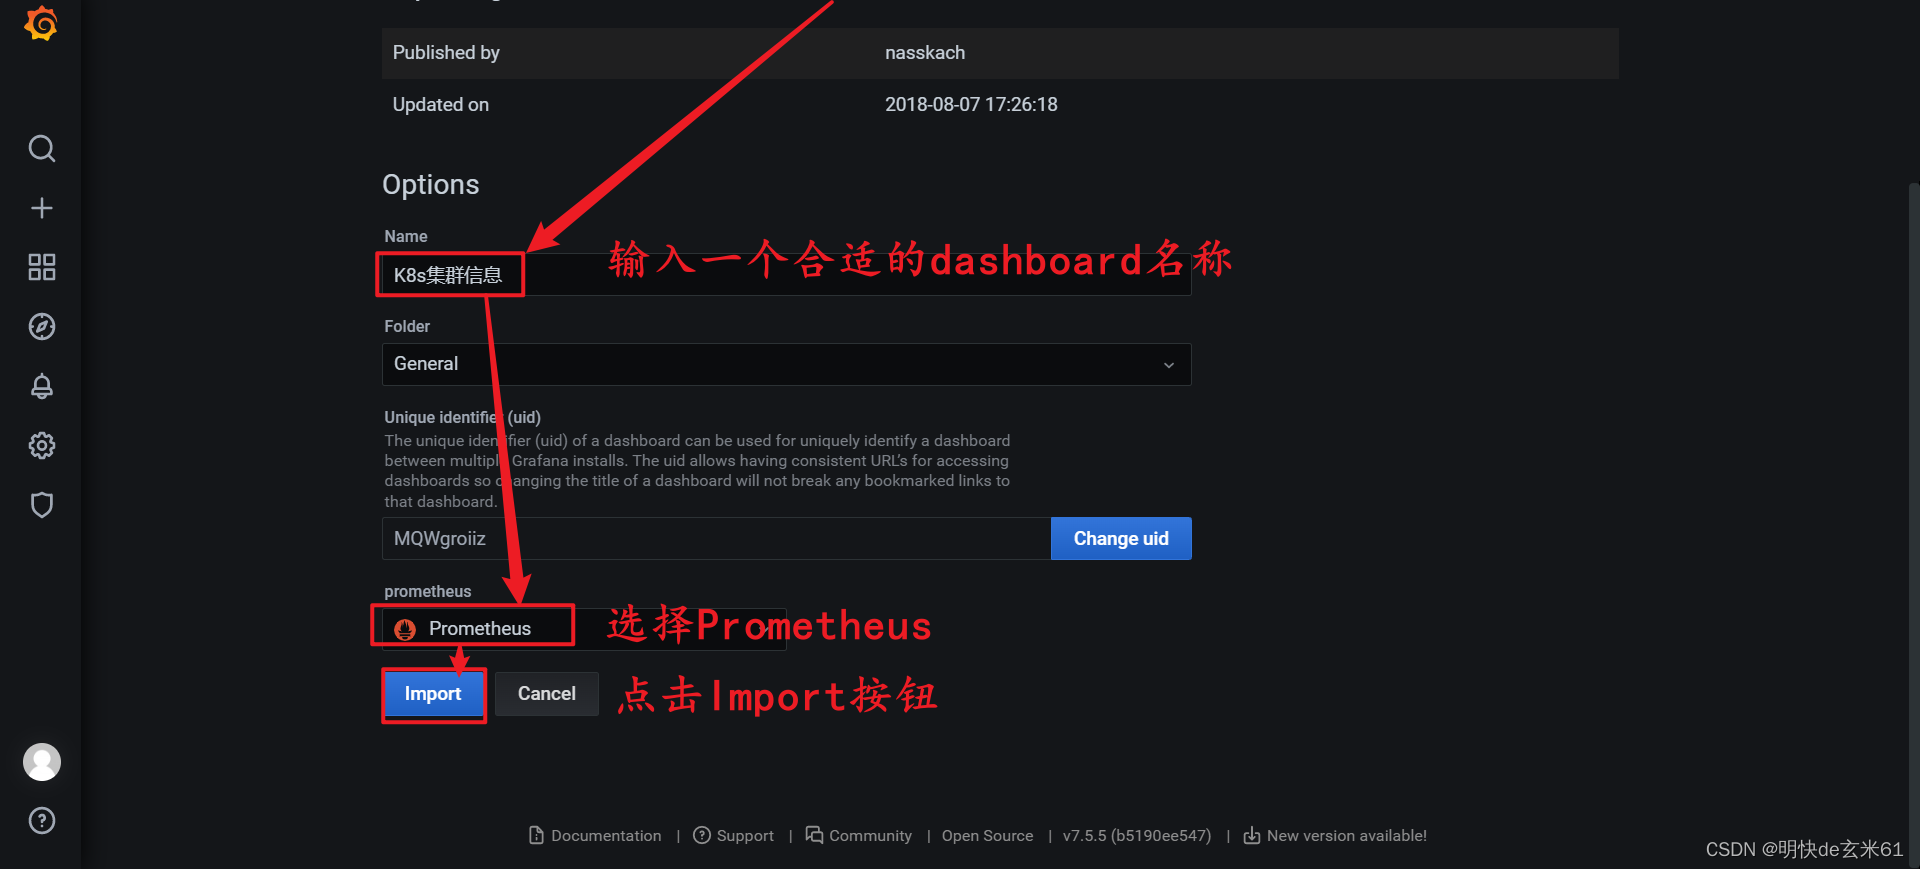
添加ID或者导入Json文件完成后,然后执行修改信息操作,最后进行导入操作,如下:
1.6、问题排查方案
如果遇到问题了,可以查看上述几个容器的日志,尤其是看下prometheus的日志报错情况,还有要看一下prometheus首页的监听情况,具体操作如下:
在浏览器中访问prometheus首页地址,比如:http://192.168.139.133:30003
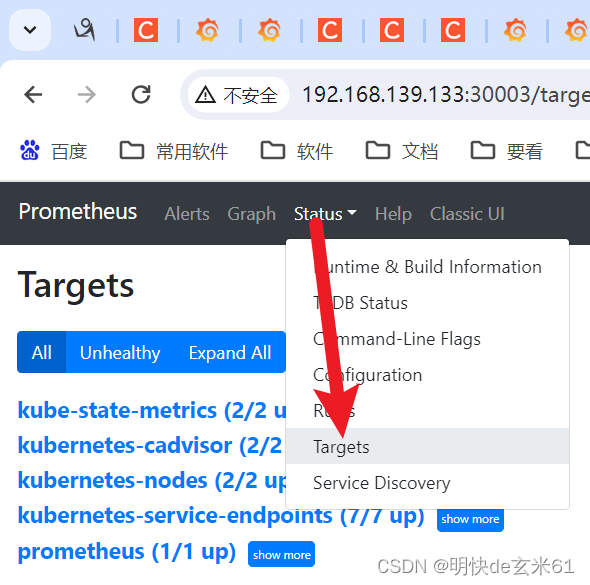
如果出现上面这几个是正确的,尤其是kube-state-metrics
1.7、参考文档
- K8S安装prometheus+kube-state-metrics+grafana
2、安装loki
2.1、创建名称空间logging
直接在kuboard平台操作
2.2、安装loki
apiVersion: v1
kind: ServiceAccount
metadata:name: lokinamespace: logging
---
apiVersion: rbac.authorization.k8s.io/v1
kind: Role
metadata:name: lokinamespace: logging
rules:
- apiGroups:- extensionsresourceNames:- lokiresources:- podsecuritypoliciesverbs:- use
---
apiVersion: rbac.authorization.k8s.io/v1
kind: RoleBinding
metadata:name: lokinamespace: logging
roleRef:apiGroup: rbac.authorization.k8s.iokind: Rolename: loki
subjects:
- kind: ServiceAccountname: loki---apiVersion: v1
data:loki.yaml: |auth_enabled: falseingester:chunk_idle_period: 3m      # 如果块没有达到最大的块大小,那么在刷新之前,块应该在内存中不更新多长时间chunk_block_size: 262144chunk_retain_period: 1m      # 块刷新后应该在内存中保留多长时间max_transfer_retries: 0      # Number of times to try and transfer chunks when leaving before falling back to flushing to the store. Zero = no transfers are done.lifecycler:       #配置ingester的生命周期,以及在哪里注册以进行发现ring:kvstore:store: inmemory      # 用于ring的后端存储,支持consul、etcd、inmemoryreplication_factor: 1      # 写入和读取的ingesters数量,至少为1(为了冗余和弹性,默认情况下为3)limits_config:enforce_metric_name: falsereject_old_samples: true      # 旧样品是否会被拒绝reject_old_samples_max_age: 168h      # 拒绝旧样本的最大时限schema_config:      # 配置从特定时间段开始应该使用哪些索引模式configs:- from: 2022-04-08      # 创建索引的日期。如果这是唯一的schema_config,则使用过去的日期,否则使用希望切换模式时的日期store: boltdb-shipper      # 索引使用哪个存储,如:cassandra, bigtable, dynamodb,或boltdbobject_store: filesystem      # 用于块的存储,如:gcs, s3, inmemory, filesystem, cassandra,如果省略,默认值与store相同schema: v11index:      # 配置如何更新和存储索引prefix: index_      # 所有周期表的前缀period: 24h      # 表周期server:http_listen_port: 3100storage_config:      # 为索引和块配置一个或多个存储boltdb_shipper:active_index_directory: /opt/loki/boltdb-shipper-activecache_location: /opt/loki/boltdb-shipper-cachecache_ttl: 24h         shared_store: filesystemfilesystem:directory: /opt/loki/chunkschunk_store_config:      # 配置如何缓存块,以及在将它们保存到存储之前等待多长时间max_look_back_period: 168h      #限制查询数据的时间,默认是禁用的,这个值应该小于或等于table_manager.retention_period中的值table_manager:retention_deletes_enabled: true      # 日志保留周期开关,用于表保留删除retention_period: 168h       # 日志保留周期,保留期必须是索引/块的倍数compactor:working_directory: /opt/loki/boltdb-shipper-compactorshared_store: filesystem
kind: ConfigMap
metadata:labels:app: lokiname: lokinamespace: logging---apiVersion: apps/v1
kind: StatefulSet
metadata:labels:app: lokiname: lokinamespace: logging
spec:selector:matchLabels:app: lokiserviceName: lokitemplate:metadata:labels:app: lokispec:containers:- args:- '-config.file=/etc/loki/loki.yaml'image: 'grafana/loki:2.3.0'imagePullPolicy: IfNotPresentlivenessProbe:failureThreshold: 3httpGet:path: /readyport: http-metricsscheme: HTTPinitialDelaySeconds: 45periodSeconds: 10successThreshold: 1timeoutSeconds: 1name: lokiports:- containerPort: 3100name: http-metricsprotocol: TCPreadinessProbe:failureThreshold: 3httpGet:path: /readyport: http-metricsscheme: HTTPinitialDelaySeconds: 45periodSeconds: 10successThreshold: 1timeoutSeconds: 1securityContext:readOnlyRootFilesystem: truevolumeMounts:- mountPath: /etc/lokiname: config- mountPath: /optname: storagesecurityContext:fsGroup: 10001runAsGroup: 10001runAsNonRoot: truerunAsUser: 10001serviceAccount: lokiserviceAccountName: lokivolumes:- configMap:name: lokiname: configvolumeClaimTemplates:- apiVersion: v1kind: PersistentVolumeClaimmetadata:name: storagespec:accessModes:- ReadWriteManyresources:requests:storage: 1GistorageClassName: "managed-nfs-storage" # 换成你自己的nfs挂载名称---apiVersion: v1
kind: Service
metadata:labels:app: lokiname: lokinamespace: logging
spec:ports:- name: http-metricsport: 3100protocol: TCPtargetPort: http-metricsselector:app: lokisessionAffinity: Nonetype: ClusterIP---apiVersion: v1
kind: Service
metadata:labels:app: lokiname: loki-outernamespace: logging
spec:ports:- name: http-metricsnodePort: 32537port: 3100targetPort: http-metricsselector:app: lokitype: NodePort
2.3、安装loki-promtail
apiVersion: v1
kind: ServiceAccount
metadata:name: loki-promtaillabels:app: promtailnamespace: logging
---
kind: ClusterRole
apiVersion: rbac.authorization.k8s.io/v1
metadata:labels:app: promtailname: promtail-clusterrolenamespace: logging
rules:
- apiGroups: [""]resources:- nodes- nodes/proxy- services- endpoints- podsverbs: ["get", "watch", "list"]
---
kind: ClusterRoleBinding
apiVersion: rbac.authorization.k8s.io/v1
metadata:name: promtail-clusterrolebindinglabels:app: promtailnamespace: logging
subjects:- kind: ServiceAccountname: loki-promtailnamespace: logging
roleRef:kind: ClusterRolename: promtail-clusterroleapiGroup: rbac.authorization.k8s.io---apiVersion: v1
data:promtail.yaml: |client:      # 配置Promtail如何连接到Loki的实例backoff_config:      # 配置当请求失败时如何重试请求给Lokimax_period: 5m max_retries: 10min_period: 500msbatchsize: 1048576      # 发送给Loki的最大批次大小(以字节为单位)batchwait: 1s      # 发送批处理前等待的最大时间(即使批次大小未达到最大值)external_labels: {}      # 所有发送给Loki的日志添加静态标签timeout: 10s      # 等待服务器响应请求的最大时间positions:filename: /run/promtail/positions.yamlserver:http_listen_port: 3101target_config:sync_period: 10sscrape_configs:- job_name: kubernetes-pods-namepipeline_stages:- docker: {}kubernetes_sd_configs:- role: podrelabel_configs:- source_labels:- __meta_kubernetes_pod_label_nametarget_label: __service__- source_labels:- __meta_kubernetes_pod_node_nametarget_label: __host__- action: dropregex: ''source_labels:- __service__- action: labelmapregex: __meta_kubernetes_pod_label_(.+)- action: replacereplacement: $1separator: /source_labels:- __meta_kubernetes_namespace- __service__target_label: job- action: replacesource_labels:- __meta_kubernetes_namespacetarget_label: namespace- action: replacesource_labels:- __meta_kubernetes_pod_nametarget_label: pod- action: replacesource_labels:- __meta_kubernetes_pod_container_nametarget_label: container- replacement: /var/log/pods/*$1/*.logseparator: /source_labels:- __meta_kubernetes_pod_uid- __meta_kubernetes_pod_container_nametarget_label: __path__- job_name: kubernetes-pods-apppipeline_stages:- docker: {}kubernetes_sd_configs:- role: podrelabel_configs:- action: dropregex: .+source_labels:- __meta_kubernetes_pod_label_name- source_labels:- __meta_kubernetes_pod_label_apptarget_label: __service__- source_labels:- __meta_kubernetes_pod_node_nametarget_label: __host__- action: dropregex: ''source_labels:- __service__- action: labelmapregex: __meta_kubernetes_pod_label_(.+)- action: replacereplacement: $1separator: /source_labels:- __meta_kubernetes_namespace- __service__target_label: job- action: replacesource_labels:- __meta_kubernetes_namespacetarget_label: namespace- action: replacesource_labels:- __meta_kubernetes_pod_nametarget_label: pod- action: replacesource_labels:- __meta_kubernetes_pod_container_nametarget_label: container- replacement: /var/log/pods/*$1/*.logseparator: /source_labels:- __meta_kubernetes_pod_uid- __meta_kubernetes_pod_container_nametarget_label: __path__- job_name: kubernetes-pods-direct-controllerspipeline_stages:- docker: {}kubernetes_sd_configs:- role: podrelabel_configs:- action: dropregex: .+separator: ''source_labels:- __meta_kubernetes_pod_label_name- __meta_kubernetes_pod_label_app- action: dropregex: '[0-9a-z-.]+-[0-9a-f]{8,10}'source_labels:- __meta_kubernetes_pod_controller_name- source_labels:- __meta_kubernetes_pod_controller_nametarget_label: __service__- source_labels:- __meta_kubernetes_pod_node_nametarget_label: __host__- action: dropregex: ''source_labels:- __service__- action: labelmapregex: __meta_kubernetes_pod_label_(.+)- action: replacereplacement: $1separator: /source_labels:- __meta_kubernetes_namespace- __service__target_label: job- action: replacesource_labels:- __meta_kubernetes_namespacetarget_label: namespace- action: replacesource_labels:- __meta_kubernetes_pod_nametarget_label: pod- action: replacesource_labels:- __meta_kubernetes_pod_container_nametarget_label: container- replacement: /var/log/pods/*$1/*.logseparator: /source_labels:- __meta_kubernetes_pod_uid- __meta_kubernetes_pod_container_nametarget_label: __path__- job_name: kubernetes-pods-indirect-controllerpipeline_stages:- docker: {}kubernetes_sd_configs:- role: podrelabel_configs:- action: dropregex: .+separator: ''source_labels:- __meta_kubernetes_pod_label_name- __meta_kubernetes_pod_label_app- action: keepregex: '[0-9a-z-.]+-[0-9a-f]{8,10}'source_labels:- __meta_kubernetes_pod_controller_name- action: replaceregex: '([0-9a-z-.]+)-[0-9a-f]{8,10}'source_labels:- __meta_kubernetes_pod_controller_nametarget_label: __service__- source_labels:- __meta_kubernetes_pod_node_nametarget_label: __host__- action: dropregex: ''source_labels:- __service__- action: labelmapregex: __meta_kubernetes_pod_label_(.+)- action: replacereplacement: $1separator: /source_labels:- __meta_kubernetes_namespace- __service__target_label: job- action: replacesource_labels:- __meta_kubernetes_namespacetarget_label: namespace- action: replacesource_labels:- __meta_kubernetes_pod_nametarget_label: pod- action: replacesource_labels:- __meta_kubernetes_pod_container_nametarget_label: container- replacement: /var/log/pods/*$1/*.logseparator: /source_labels:- __meta_kubernetes_pod_uid- __meta_kubernetes_pod_container_nametarget_label: __path__- job_name: kubernetes-pods-staticpipeline_stages:- docker: {}kubernetes_sd_configs:- role: podrelabel_configs:- action: dropregex: ''source_labels:- __meta_kubernetes_pod_annotation_kubernetes_io_config_mirror- action: replacesource_labels:- __meta_kubernetes_pod_label_componenttarget_label: __service__- source_labels:- __meta_kubernetes_pod_node_nametarget_label: __host__- action: dropregex: ''source_labels:- __service__- action: labelmapregex: __meta_kubernetes_pod_label_(.+)- action: replacereplacement: $1separator: /source_labels:- __meta_kubernetes_namespace- __service__target_label: job- action: replacesource_labels:- __meta_kubernetes_namespacetarget_label: namespace- action: replacesource_labels:- __meta_kubernetes_pod_nametarget_label: pod- action: replacesource_labels:- __meta_kubernetes_pod_container_nametarget_label: container- replacement: /var/log/pods/*$1/*.logseparator: /source_labels:- __meta_kubernetes_pod_annotation_kubernetes_io_config_mirror- __meta_kubernetes_pod_container_nametarget_label: __path__- job_name: ms-gateway-server-testpipeline_stages:static_configs:- targets:- localhostlabels:#标签,用于后面的查询job: ms-gateway-server-test__path__: /var/log/ms-gateway-server-test/*.log
kind: ConfigMap
metadata:labels:app: promtailname: loki-promtailnamespace: logging---
apiVersion: apps/v1
kind: DaemonSet
metadata:annotations:deprecated.daemonset.template.generation: '3'labels:app: promtailname: loki-promtailnamespace: logging
spec:selector:matchLabels:app: promtailtemplate:metadata:labels:app: promtailspec:containers:- args:- '-config.file=/etc/promtail/promtail.yaml'- '-client.url=http://loki:3100/loki/api/v1/push' # 配置loki连接信息env:- name: HOSTNAMEvalueFrom:fieldRef:apiVersion: v1fieldPath: spec.nodeNameimage: 'grafana/promtail:2.3.0'imagePullPolicy: IfNotPresentname: promtailports:- containerPort: 3101name: http-metricsprotocol: TCPreadinessProbe:failureThreshold: 5httpGet:path: /readyport: http-metricsscheme: HTTPinitialDelaySeconds: 10periodSeconds: 10successThreshold: 1timeoutSeconds: 1securityContext:runAsGroup: 0runAsUser: 0volumeMounts:- mountPath: /etc/promtailname: config- mountPath: /run/promtailname: run- mountPath: /var/lib/kubelet/podsname: kubelet- mountPath: /var/lib/docker/containers # docker容器日志位置,需要根据你的docker安装情况来,有可能是/opt/docker/containersname: docker- mountPath: /var/log/podsname: pods- mountPath: /var/logname: logserviceAccount: loki-promtailserviceAccountName: loki-promtailtolerations:- effect: NoSchedulekey: node-role.kubernetes.io/masteroperator: Existsvolumes:- configMap:name: loki-promtailname: config- hostPath:path: /run/promtailtype: ''name: run- hostPath:path: /var/lib/kubelet/podstype: ''name: kubelet- hostPath:path: /var/lib/docker/containers # docker容器日志位置,需要根据你的docker安装情况来,有可能是/opt/docker/containerstype: ''name: docker- hostPath:path: /var/log/podstype: ''name: pods- hostPath:path: /opt/logtype: ''name: log
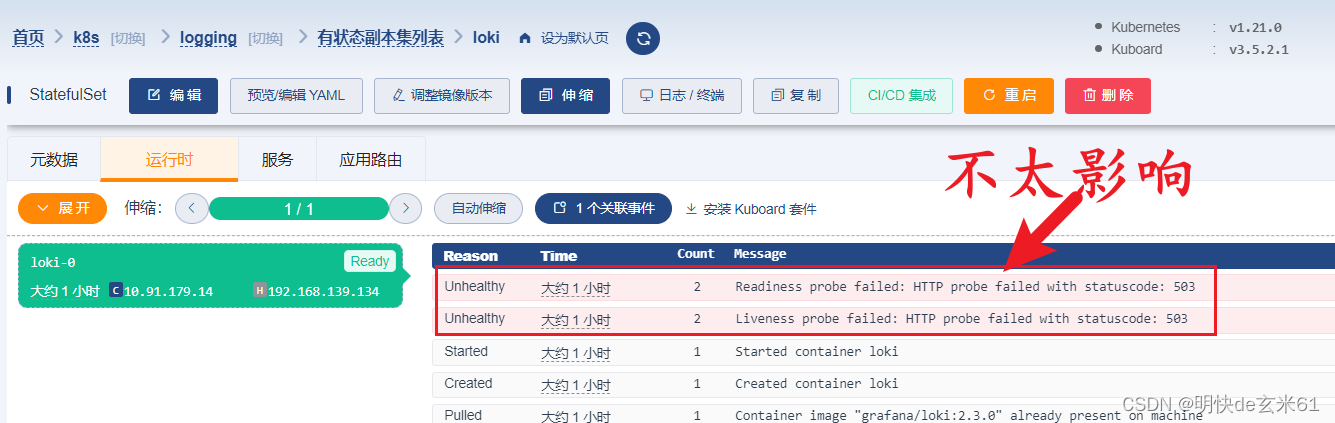
2.3、判断loki是否安装成功
首先loki和loki-promtail都要运行良好,即使loki会出现503问题,也不会太影响
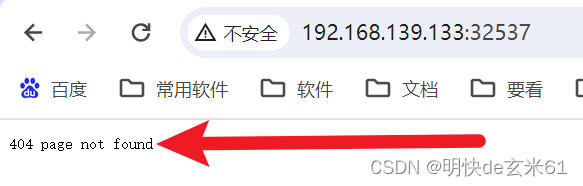
然后访问loki的对外访问地址,比如:http://192.168.139.133:32537/,如果出现404 page not found,说明就是启动好了
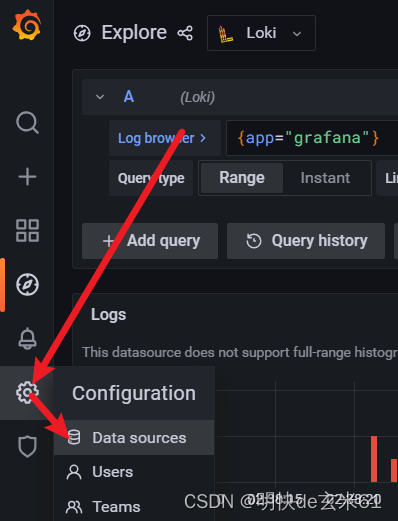
2.5、在grafana中配置loki
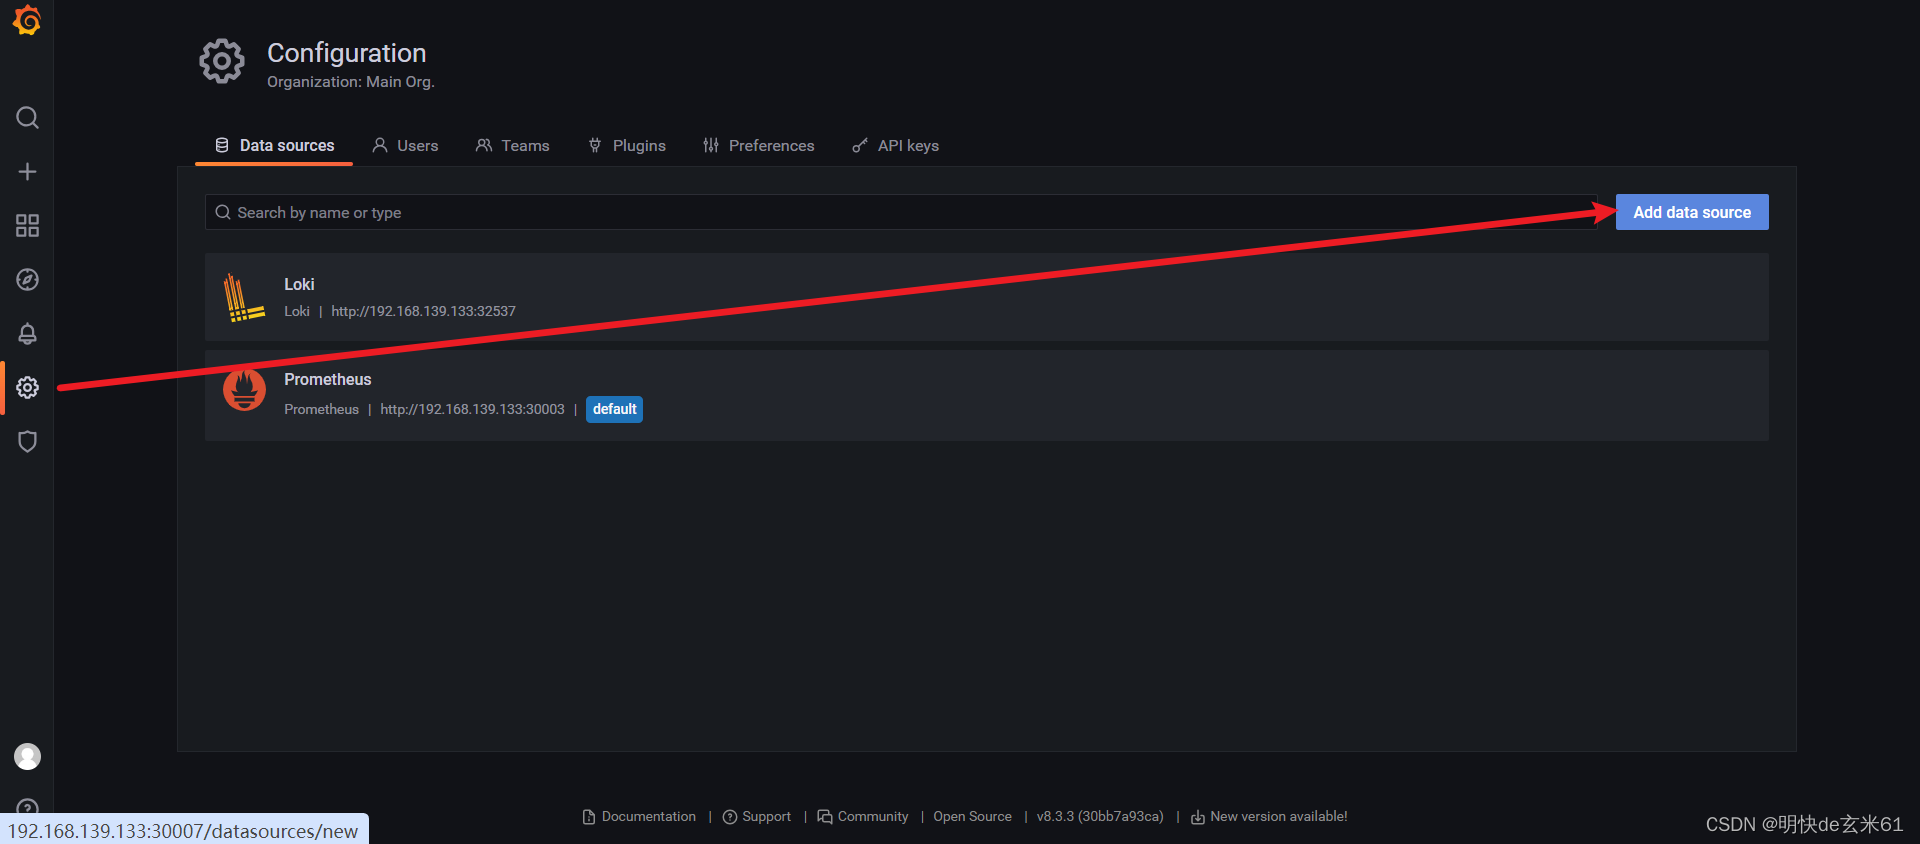
登录grafana首页,在左侧点击设置按钮,然后在弹出列表中点击Data sources按钮:
然后点击右侧的Add data source按钮:
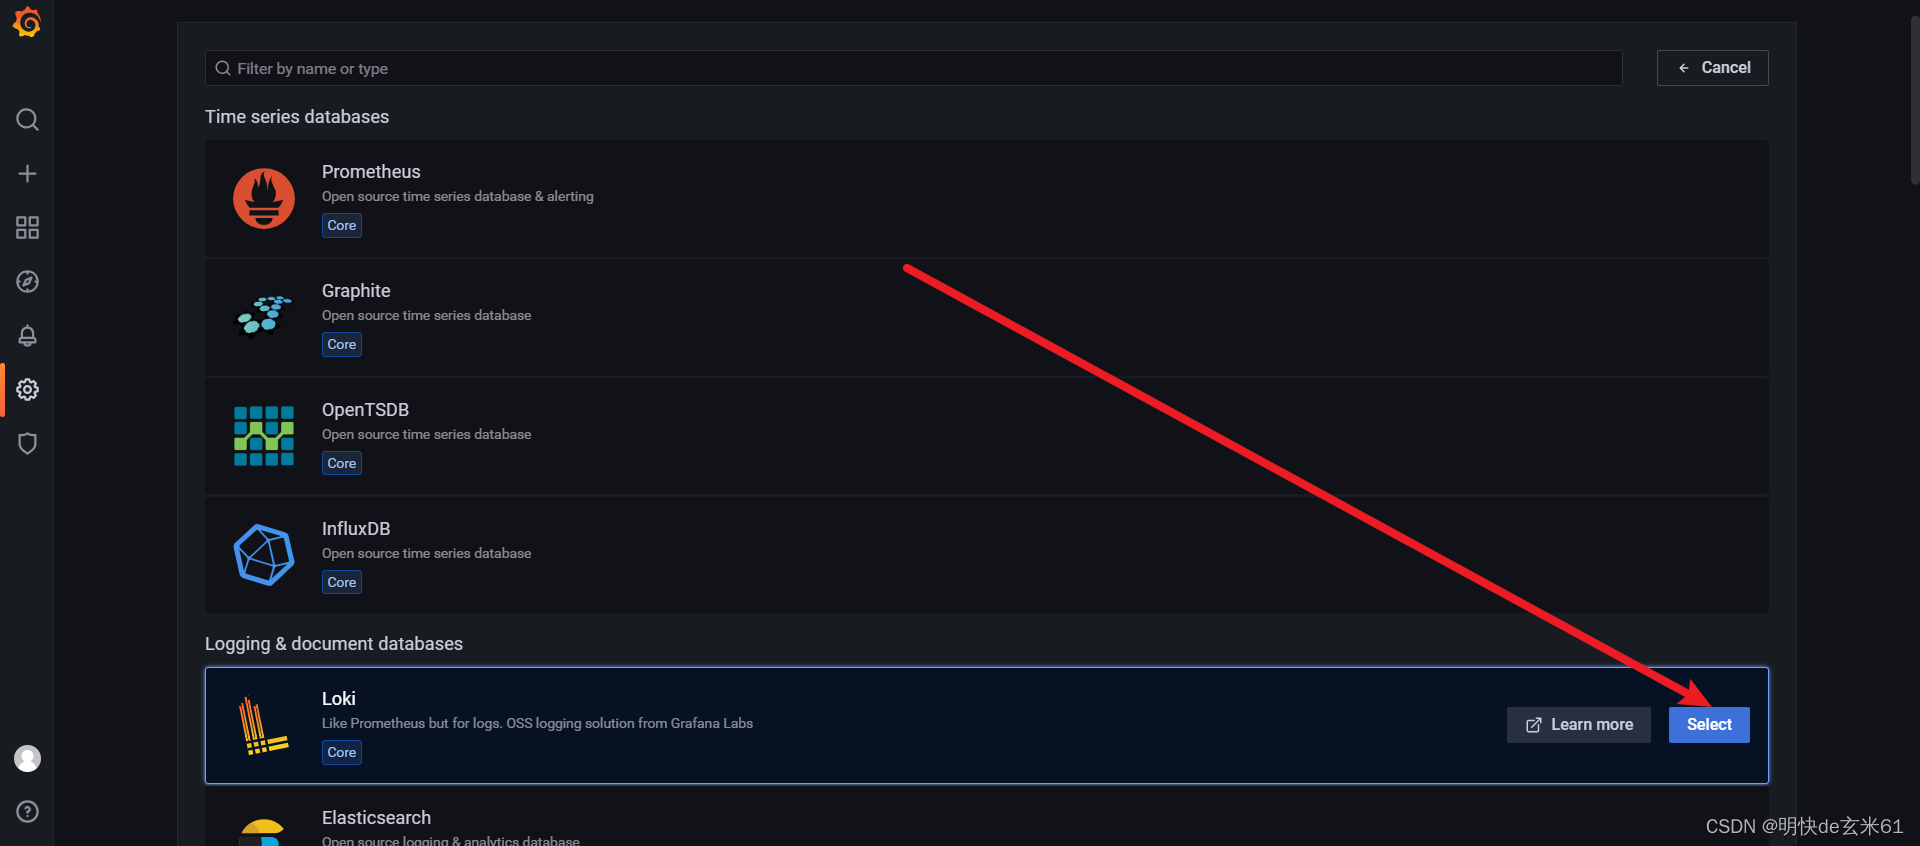
之后选择下面的Loki:
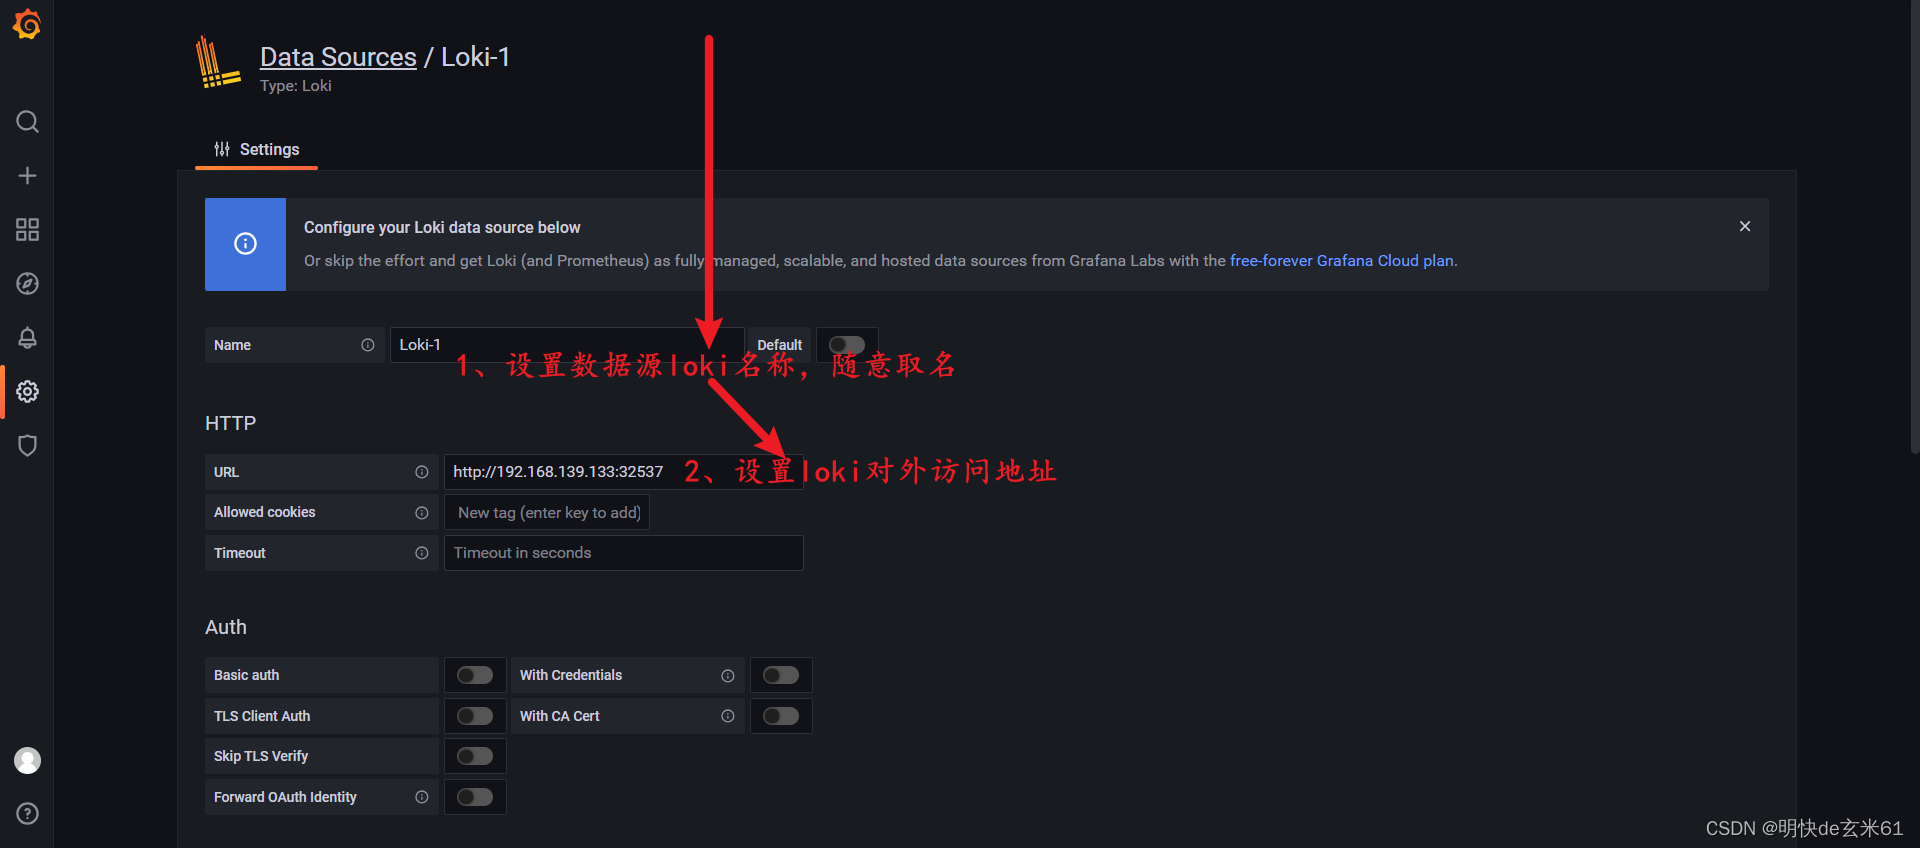
然后设置loki连接信息:
2.6、在grafana中使用loki
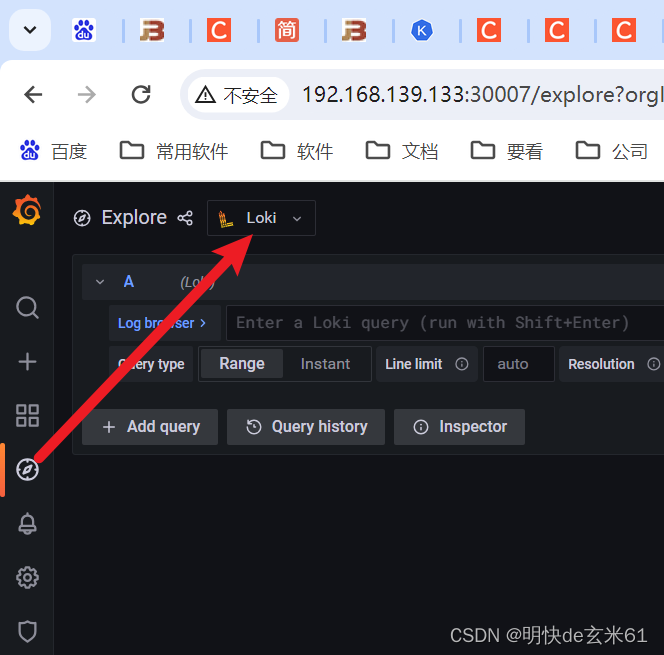
首先登录grafana首页,然后点击左侧的Explorer按钮,之后将上方数据源切换成Loki,然后就可以使用了
3、安装postgresql
3.1、创建名称空间postgresql
在kuboard页面上创建即可
3.2、执行yaml
apiVersion: apps/v1
kind: StatefulSet
metadata:labels:k8s.kuboard.cn/name: postgresqlname: postgresqlnamespace: postgresql
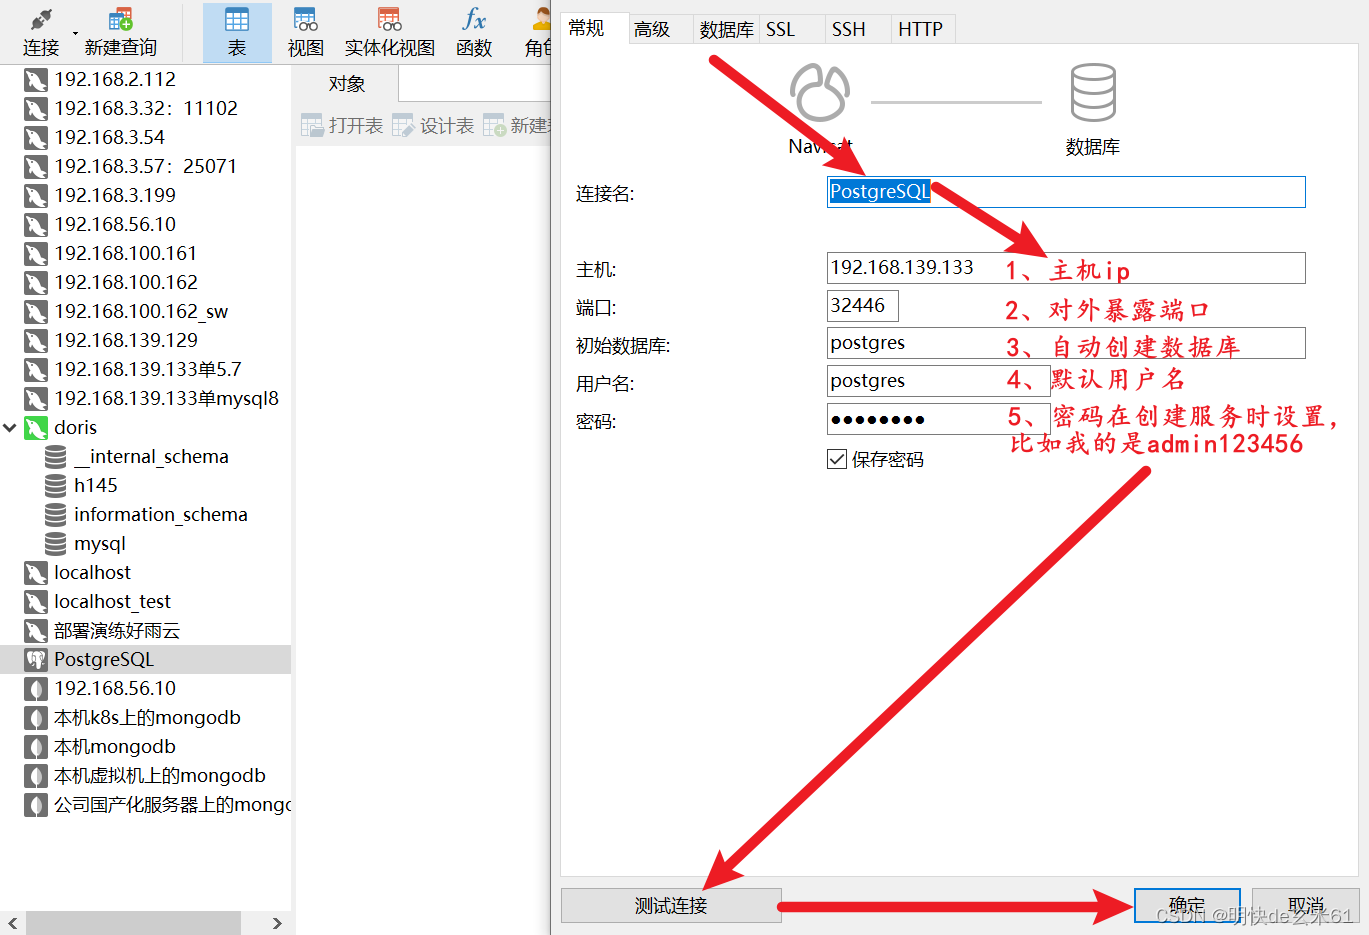
spec:selector:matchLabels:k8s.kuboard.cn/name: postgresqlserviceName: postgresqltemplate:metadata:labels:k8s.kuboard.cn/name: postgresqlspec:containers:- env:- name: POSTGRES_PASSWORDvalue: admin123456 # 设置密码- name: PGDATAvalue: /var/lib/postgresql/data/pgdataimage: 'postgres:14.4-alpine3.16'imagePullPolicy: IfNotPresentname: postgresqlports:- containerPort: 5432name: pgportprotocol: TCPvolumeMounts:- mountPath: /var/lib/postgresql/dataname: datavolumeClaimTemplates:- apiVersion: v1kind: PersistentVolumeClaimmetadata:name: dataspec:accessModes:- ReadWriteManyresources:requests:storage: 1GistorageClassName: "managed-nfs-storage" # 换成你自己的nfs挂载名称---apiVersion: v1
kind: Service
metadata:labels:k8s.kuboard.cn/name: postgresqlname: postgresqlnamespace: postgresql
spec:ports:- name: portnodePort: 32446port: 5432protocol: TCPtargetPort: 5432selector:k8s.kuboard.cn/name: postgresqltype: NodePort
3.3、使用Navicat连接postgresql
按照下图输入相关信息即可
4、安装doris(TODO 最后搭建起来还是会报错,后续在解决吧)
4.1、创建名称空间doris-cluster
在kuboard页面上创建即可
4.2、搭建doris-be-cluster服务
apiVersion: v1
data:# priority_networks的属性值里面是容器ip,可以通过kubectl get pod -A -owide找到be.conf: |PPROF_TMPDIR="$DORIS_HOME/log/"sys_log_level = INFObe_port = 9060webserver_port = 8040heartbeat_service_port = 9050brpc_port = 8060priority_networks = 10.91.0.0/24
kind: ConfigMap
metadata:name: be-confnamespace: doris-cluster---apiVersion: apps/v1
kind: StatefulSet
metadata:labels:app: doris-be-clustername: doris-be-clusternamespace: doris-cluster
spec:replicas: 3selector:matchLabels:app: doris-be-clusterserviceName: doris-be-clustertemplate:metadata:labels:app: doris-be-clustername: doris-be-clusterspec:containers:- env:- name: BUILD_TYPEvalue: k8simage: 'apache/doris:2.0.0_alpha-be-x86_64'imagePullPolicy: IfNotPresentname: doris-be-clusterports:- containerPort: 9060name: be-portprotocol: TCP- containerPort: 8040name: webserver-portprotocol: TCP- containerPort: 9050name: heartbeat-portprotocol: TCP- containerPort: 8060name: brpc-portprotocol: TCPvolumeMounts:- mountPath: /opt/apache-doris/be/confname: conf- mountPath: /opt/apache-doris/be/storagename: pvc-doris-cluster-be- mountPath: /etc/pkiname: sysreadOnly: truevolumes:- configMap:name: be-confname: conf- hostPath:path: /etc/pkitype: ''name: sysvolumeClaimTemplates:- apiVersion: v1kind: PersistentVolumeClaimmetadata:name: pvc-doris-cluster-bespec:accessModes:- ReadWriteOnceresources:requests:storage: 1GistorageClassName: managed-nfs-storage---apiVersion: v1
kind: Service
metadata:labels:app: doris-be-clustername: doris-be-clusternamespace: doris-cluster
spec:ports:- name: be-portport: 9060protocol: TCPtargetPort: 9060- name: webserver-portport: 8040protocol: TCPtargetPort: 8040- name: heartbeat-portport: 9050protocol: TCPtargetPort: 9050- name: brpc-portport: 8060protocol: TCPtargetPort: 8060selector:app: doris-be-clustertype: ClusterIP
4.3、搭建doris-cn-cluster服务
apiVersion: v1
data:# priority_networks的属性值里面是容器ip,可以通过kubectl get pod -A -owide找到be.conf: |PPROF_TMPDIR="$DORIS_HOME/log/"sys_log_level = INFObe_port = 9060webserver_port = 8040heartbeat_service_port = 9050brpc_port = 8060#Specify node type as calculation nodebe_node_role = computationpriority_networks = 10.91.0.0/24
kind: ConfigMap
metadata:name: cn-confnamespace: doris-cluster---
apiVersion: apps/v1
kind: StatefulSet
metadata:labels:app: doris-cn-clustername: doris-cn-clusternamespace: doris-cluster
spec:selector:matchLabels:app: doris-cn-clusterserviceName: doris-cn-clustertemplate:metadata:labels:app: doris-cn-clustername: doris-cn-clusterspec:containers:- env:- name: BUILD_TYPEvalue: k8simage: 'apache/doris:2.0.0_alpha-be-x86_64'name: doris-cn-clusterports:- containerPort: 9060name: be-portprotocol: TCP- containerPort: 8040name: webserver-portprotocol: TCP- containerPort: 9050name: heartbeat-portprotocol: TCP- containerPort: 8060name: brpc-portprotocol: TCPvolumeMounts:- mountPath: /opt/apache-doris/be/confname: conf- mountPath: /etc/pkiname: sysreadOnly: truevolumes:- configMap:name: cn-confname: conf- hostPath:path: /etc/pkitype: ''name: sys---apiVersion: v1
kind: Service
metadata:labels:app: doris-cn-clustername: doris-cn-clusternamespace: doris-cluster
spec:ports:- name: be-portport: 9060protocol: TCPtargetPort: 9060- name: webserver-portport: 8040protocol: TCPtargetPort: 8040- name: heartbeat-portport: 9050protocol: TCPtargetPort: 9050- name: brpc-portport: 8060protocol: TCPtargetPort: 8060selector:app: doris-cn-clustertype: ClusterIP
4.4、搭建doris-follower-cluster服务
apiVersion: rbac.authorization.k8s.io/v1
kind: ClusterRole
metadata:name: doris-cluster
rules:- apiGroups:- ''- appsresources:- nodes- nodes/proxy- services- endpoints- pods- statefulsetsverbs:- get- watch- list---apiVersion: v1
kind: ServiceAccount
metadata:name: doris-clusternamespace: doris-cluster---apiVersion: rbac.authorization.k8s.io/v1
kind: ClusterRoleBinding
metadata:name: doris-cluster
roleRef:apiGroup: rbac.authorization.k8s.iokind: ClusterRolename: doris-cluster
subjects:
- kind: ServiceAccountname: doris-clusternamespace: doris-cluster---apiVersion: v1
data:# priority_networks的属性值里面是容器ip,可以通过kubectl get pod -A -owide找到fe.conf: >priority_networks = 10.91.0.0/24#It can automatically maintain node information by getting the number ofreplicas of StatefulSet, similar to alter system add/drop backenable_deploy_manager = k8s#Automatically adjust the IP of the node according to the domain name (forexample, after the pod is restarted, the domain name is stilldoris-be-cluster1-0-doris-be-cluster1.default.svc.cluster.local, but the IPmay change from 172.16.0.9 to 172.16.0.10)enable_fqdn_mode = trueLOG_DIR = ${DORIS_HOME}/logsys_log_level = INFOhttp_port = 8030rpc_port = 9020query_port = 9030edit_log_port = 9010#Doris needs to generate the log4j configuration file according to thefe.yml configuration information, which is written in the same directory asfe.yml by default, but the config we mount is readonly, so specify thisconfiguration to write the log4j file to another locationcustom_config_dir = /opt/apache-doris/#when set to false, the backend will not be dropped and remaining inDECOMMISSION statedrop_backend_after_decommission = false
kind: ConfigMap
metadata:name: follower-confnamespace: doris-cluster---
apiVersion: apps/v1
kind: StatefulSet
metadata:labels:app: doris-follower-clustername: doris-follower-clusternamespace: doris-cluster
spec:selector:matchLabels:app: doris-follower-clusterserviceName: doris-follower-clustertemplate:metadata:labels:app: doris-follower-clustername: doris-follower-clusterspec:containers:- env:- name: BUILD_TYPEvalue: k8s- name: APP_NAMESPACEvalue: doris-cluster- name: FE_INIT_NUMBERvalue: '1'- name: CN_SERVICEvalue: doris-cn-cluster- name: CN_STATEFULSETvalue: doris-cn-cluster- name: BE_SERVICEvalue: doris-be-cluster- name: BE_STATEFULSETvalue: doris-be-cluster- name: FE_SERVICEvalue: doris-follower-cluster- name: FE_STATEFULSETvalue: doris-follower-clusterimage: 'apache/doris:2.0.0_alpha-fe-x86_64'name: doris-follower-clusterports:- containerPort: 8030name: http-portprotocol: TCP- containerPort: 9020name: rpc-portprotocol: TCP- containerPort: 9030name: query-portprotocol: TCP- containerPort: 9010name: edit-log-portprotocol: TCPvolumeMounts:- mountPath: /opt/apache-doris/fe/confname: conf- mountPath: /opt/apache-doris/fe/doris-metaname: pvc-doris-cluster-fe- mountPath: /root/.kube/configname: kubereadOnly: trueserviceAccount: doris-clusterserviceAccountName: doris-clustervolumes:- configMap:name: follower-confname: conf- hostPath:path: /root/.kube/configtype: ''name: kubevolumeClaimTemplates:- apiVersion: v1kind: PersistentVolumeClaimmetadata:name: pvc-doris-cluster-fespec:accessModes:- ReadWriteOnceresources:requests:storage: 1GistorageClassName: "managed-nfs-storage" # 换成你自己的nfs挂载名称---apiVersion: v1
kind: Service
metadata:labels:app: doris-follower-clustername: doris-follower-clusternamespace: doris-cluster
spec:ports:- name: http-portnodePort: 31446port: 8030protocol: TCPtargetPort: 8030- name: rpc-portnodePort: 32047port: 9020protocol: TCPtargetPort: 9020- name: query-portnodePort: 31997port: 9030protocol: TCPtargetPort: 9030- name: edit-log-portnodePort: 31954port: 9010protocol: TCPtargetPort: 9010selector:app: doris-follower-clustertype: NodePort
![[Docker] Docker为什么出现](https://img-blog.csdnimg.cn/direct/eb8c99a6ce3049ea8d0d7a26c5f8ed28.png)