文章目录
- 前言
- 一、原图
- 1.边缘图
- 2.骨架图
- 二、实现思路
- 1.边缘图
- 2.骨架图
- 三、halcon脚本实现
- 1.边缘图
- 2.骨架图
- 四、实现效果
- 1.边缘图
- 2.骨架图
前言
本文实现基于图像进行边缘或者骨架的识别,可实现让机器人画画
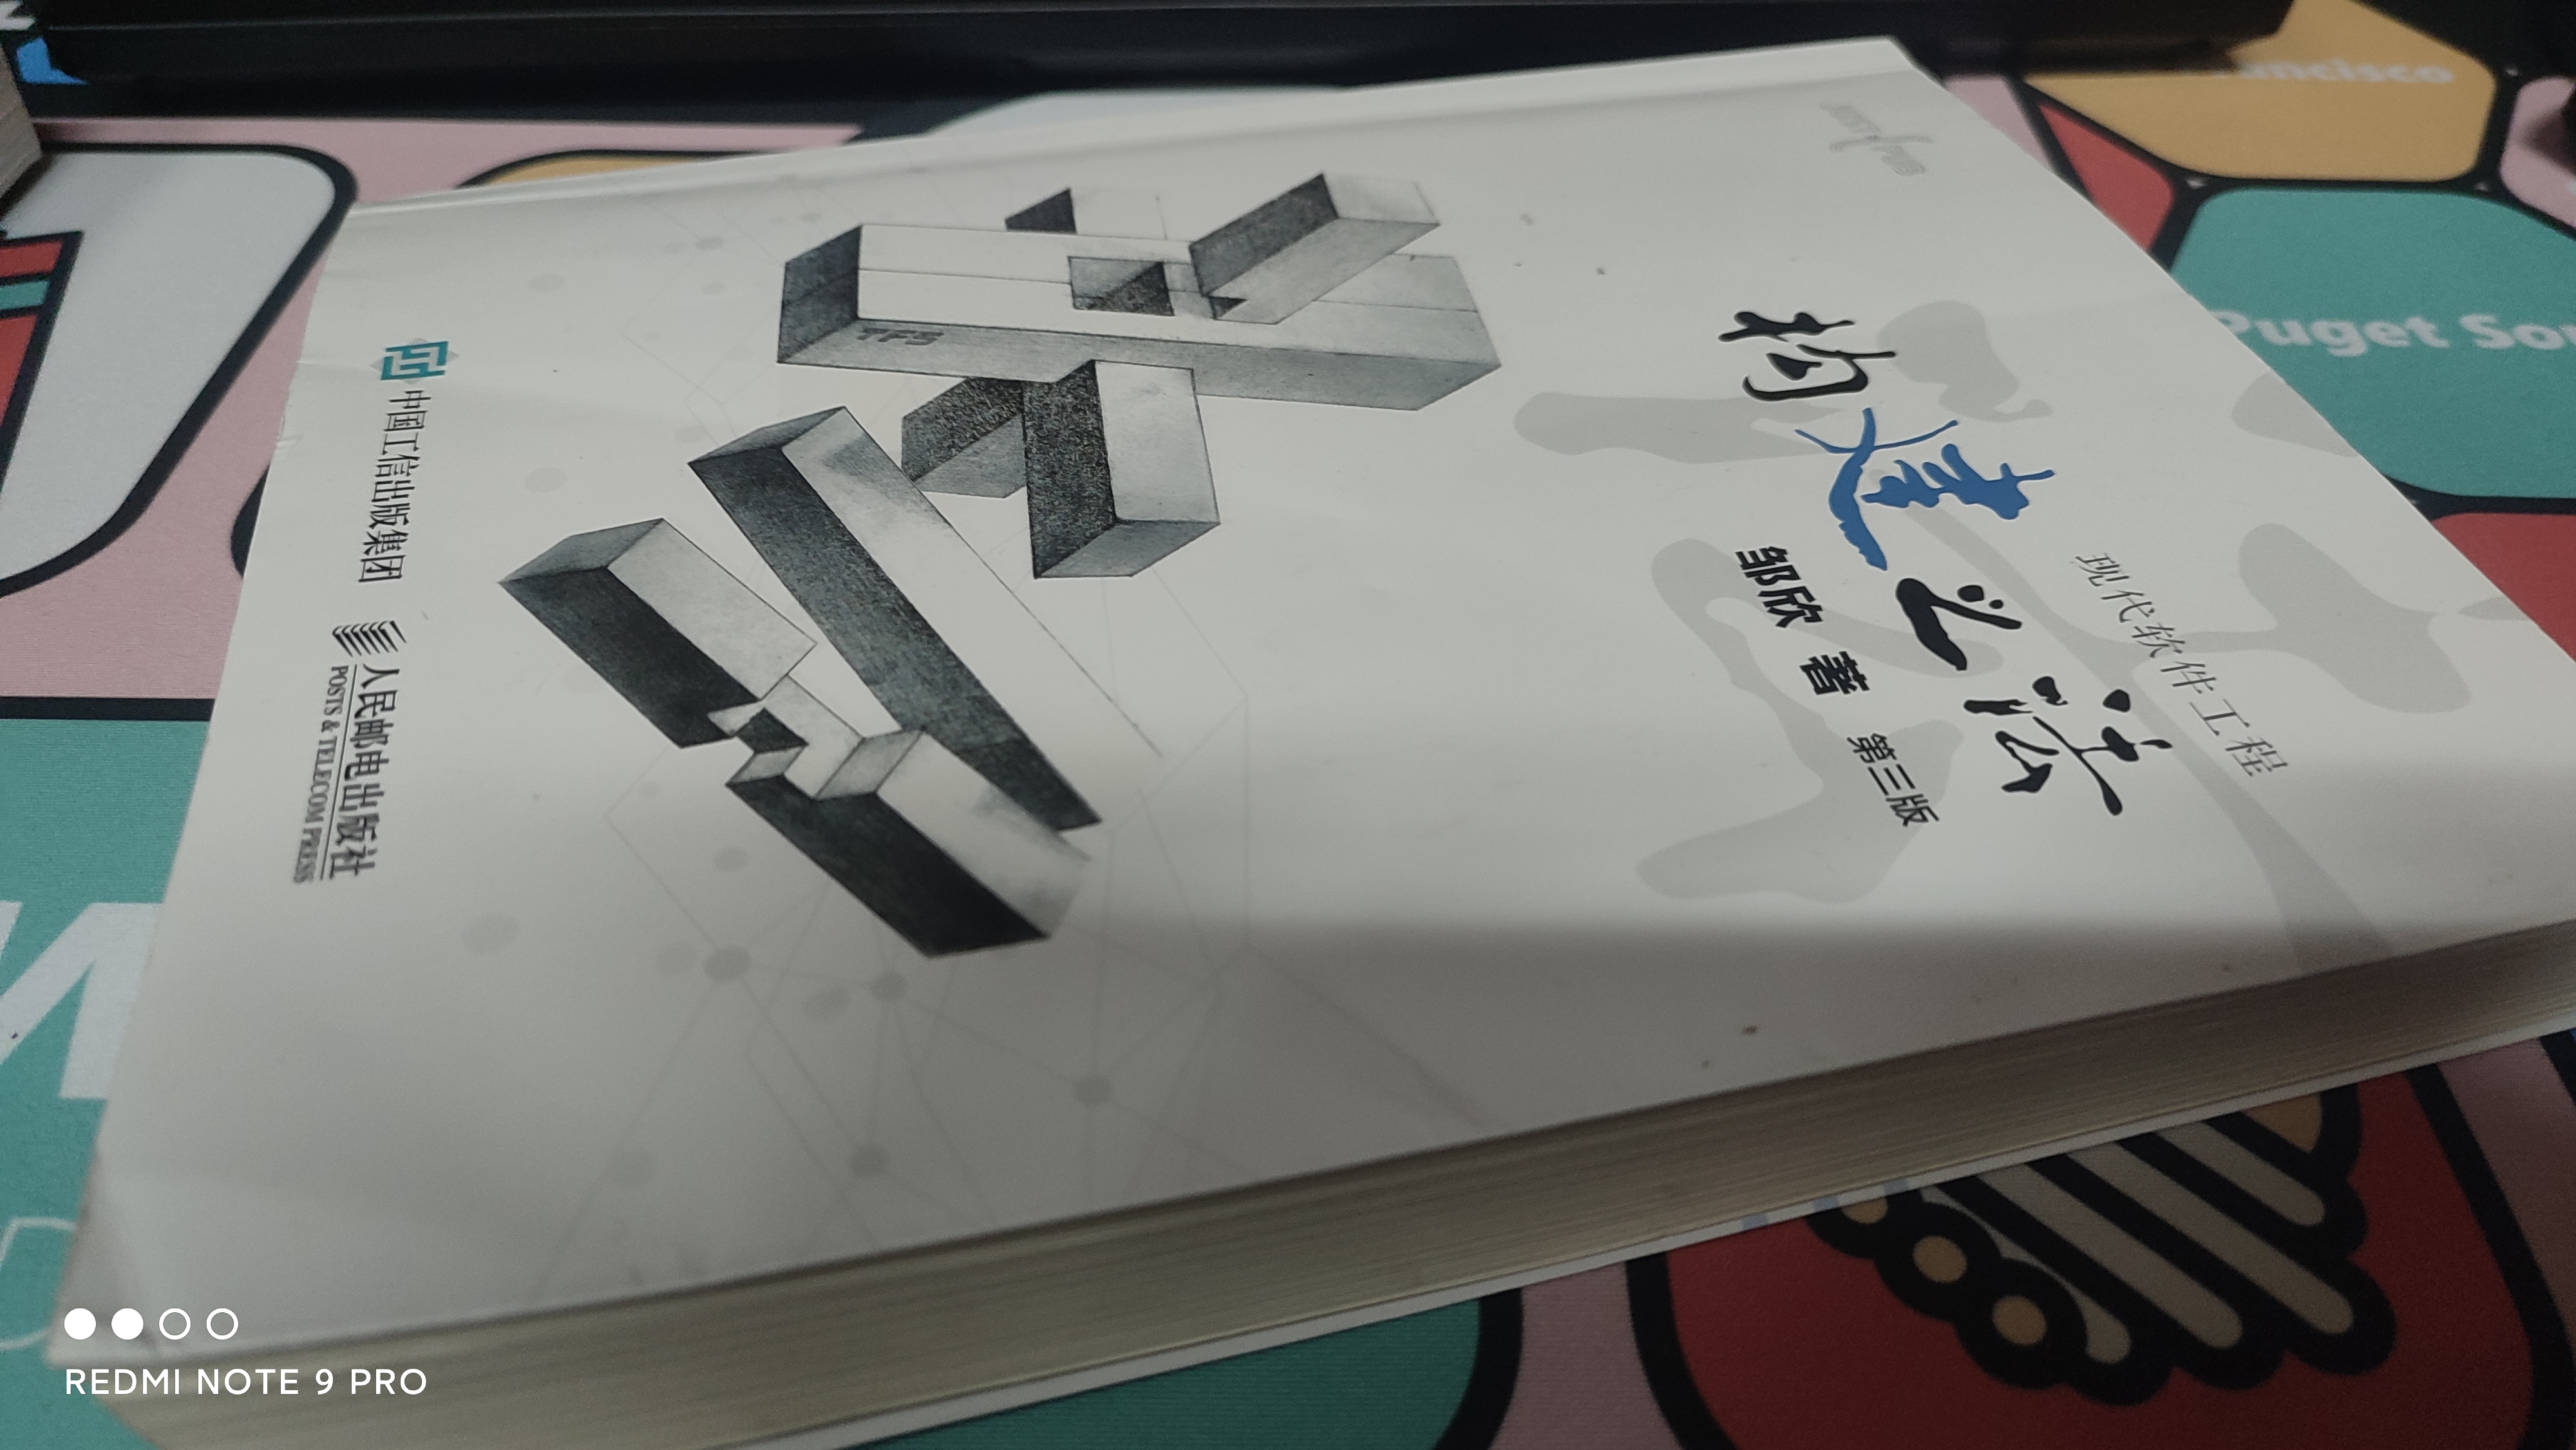
一、原图
1.边缘图

2.骨架图

二、实现思路
1.边缘图
- 提取边缘算子,edges_sub_pix
- 二值化获取区域
- 根据xld区域获取点
2.骨架图
- 首先对图像进行二值化,区域筛选出需要的位置
- 使用skeleton算子把区域变成了线条
- 使用gen_contours_skeleton_xld算子把整个区域线条变成话比xld
- 使用get_polygon_xld获取坐标
三、halcon脚本实现
1.边缘图
read_image (image, '1.jpg')   //读取图像
edges_sub_pix (image, Edges, 'canny', 1, 5, 40)
binary_threshold (image, Region, 'max_separability', 'dark', UsedThreshold)
gen_contour_region_xld (Region, Contours, 'border_holes')
gen_region_contour_xld(Contours,a,'margin')
union_cotangential_contours_xld (Contours, UnionContours1, 0, 30, 0.785398, 25, 10, 2, 'attr_forget')
count_obj (UnionContours1, Number1)
union_adjacent_contours_xld (Contours, UnionContours2, 10, 1, 'attr_keep')
count_obj (UnionContours2, Number2)
sort_contours_xld (Contours, SortedContours, 'upper_left', 'true', 'column')
count_obj (SortedContours, Number)
for Index := 1 to Number by 1select_obj (SortedContours, ObjectSelected, Index)*gen_region_contour_xld (ObjectSelected, Region1, 'filled')*get_region_points (Region1, Rows, Columns)gen_polygons_xld (ObjectSelected, Polygons, 'ramer', 1)get_polygon_xld (Polygons, Row, Col, Length, Phi)*stop ()
endfor
2.骨架图
read_image (Writing, '1.png')
binary_threshold (Writing, Region, 'max_separability', 'dark', UsedThreshold)
select_shape (Region, SelectedRegions, 'area', 'and', 20, 99999999)
skeleton (SelectedRegions, Skeleton)
gen_contours_skeleton_xld (Skeleton, Contours, 1, 'filter')
union_cotangential_contours_xld (Contours, UnionContours1, 0, 30, 0.785398, 25, 10, 2, 'attr_forget')
count_obj (UnionContours1, Number1)
union_adjacent_contours_xld (Contours, UnionContours2, 10, 1, 'attr_keep')
count_obj (UnionContours2, Number2)
sort_contours_xld (Contours, SortedContours, 'upper_left', 'true', 'column')
dev_clear_window ()
count_obj (SortedContours, Number)
for Index := 1 to Number by 1select_obj (SortedContours, ObjectSelected, Index)gen_polygons_xld (ObjectSelected, Polygons, 'ramer', 2)get_polygon_xld (Polygons, Row, Col, Length, Phi)
*    stop ()
endfor
四、实现效果
1.边缘图
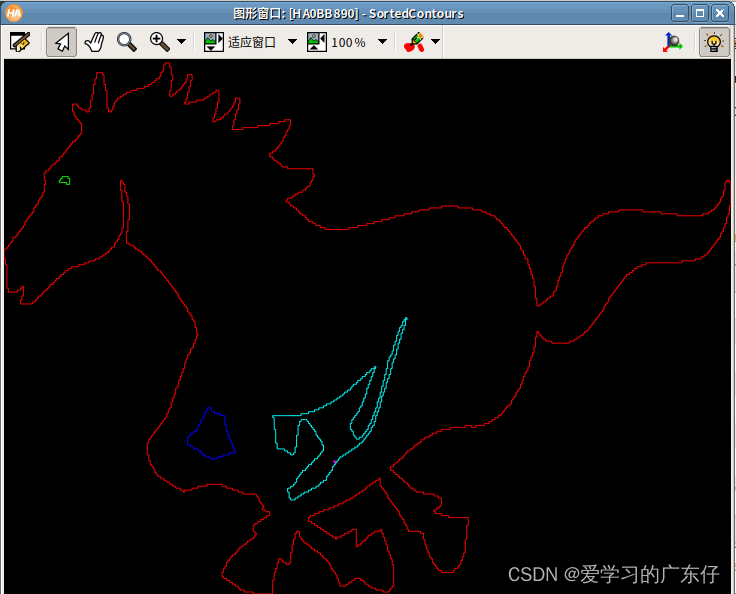
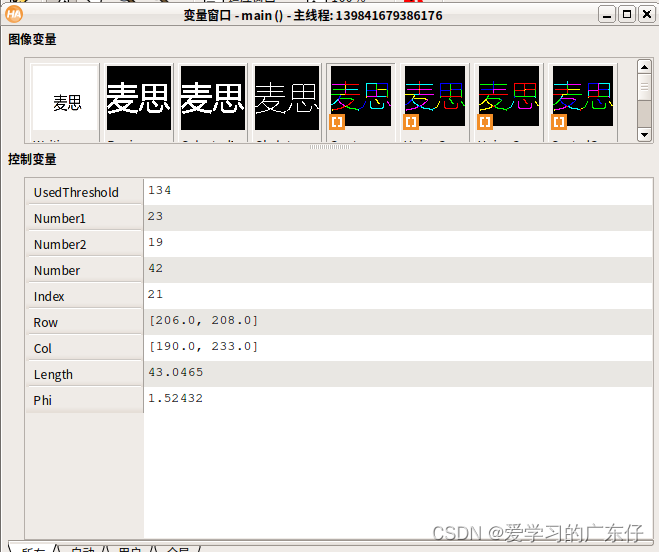
从颜色上可区分出这里绘制需要4笔,
数据在变量:Row, Col, Length, Phi
如图:

2.骨架图
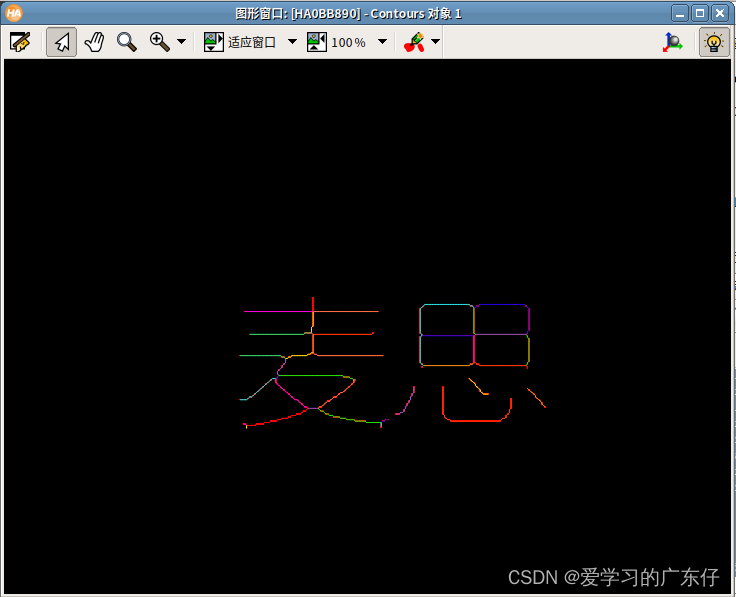
数据在变量:Row, Col, Length, Phi
如图: