文章目录
- 1.优化jvm和openfile相关参数
- 2.排除网络延迟(仅供参考)
- 3 查看服务器资源的使用情况
- 3.1查看方式
- 3.1.1cpu占用过高
- 方法1:使用脚本show-busy-java-threads.sh进行分析
- 方法2:使用jstack
- 3.1.2内存占用过高
- 3.1.1线程阻塞
- 3 数据源原因
- 4.应用代码层面
- 5.查看并杀掉僵尸进程(仅供参考)
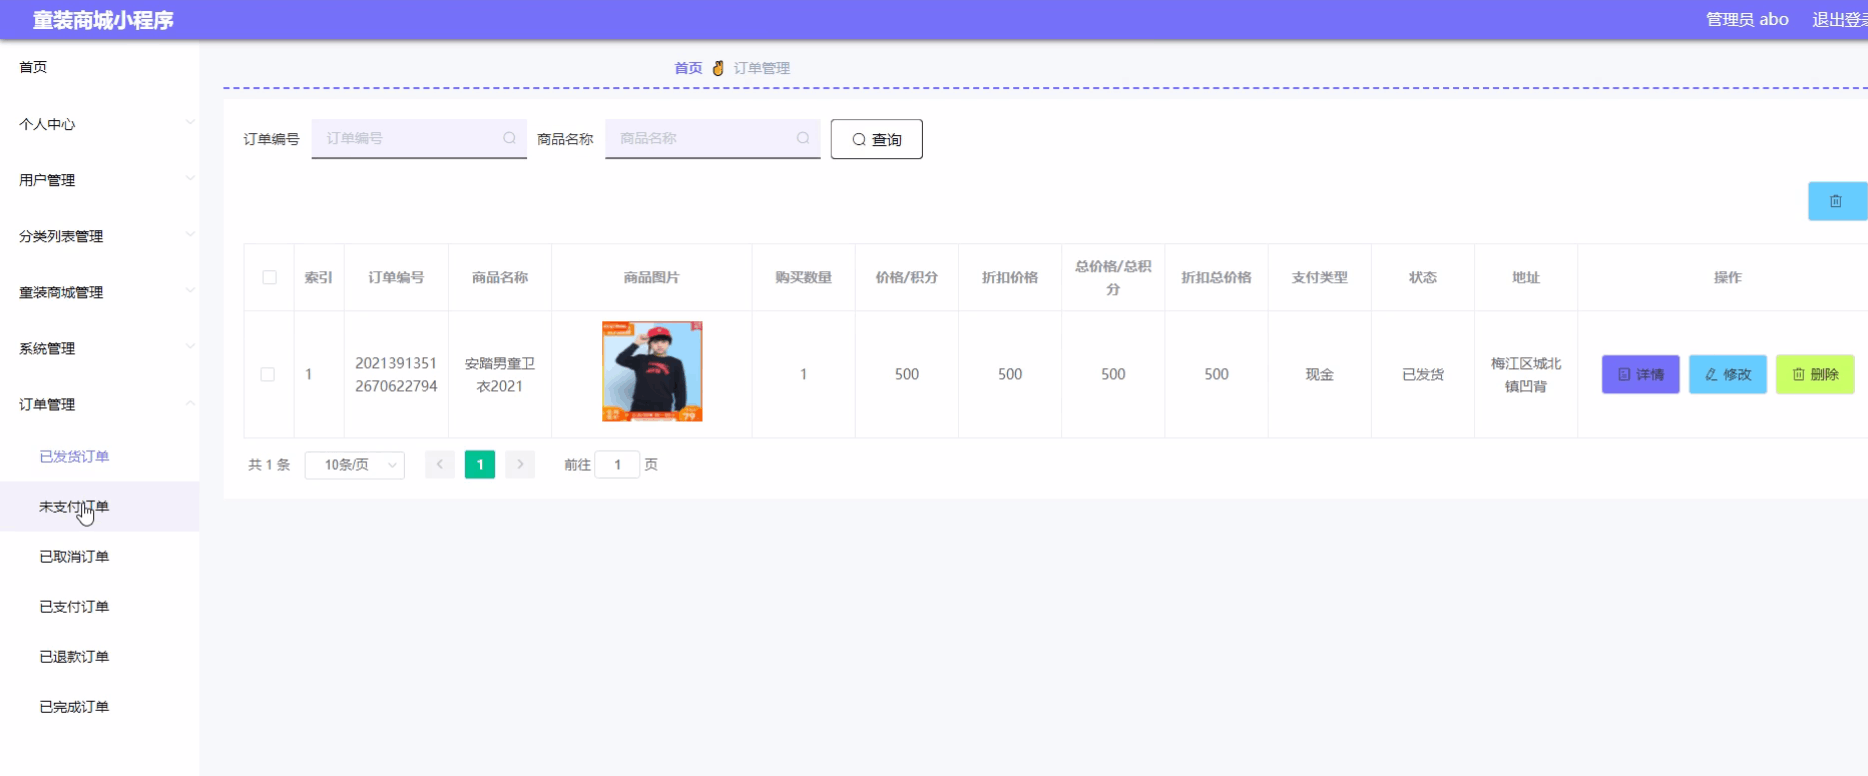
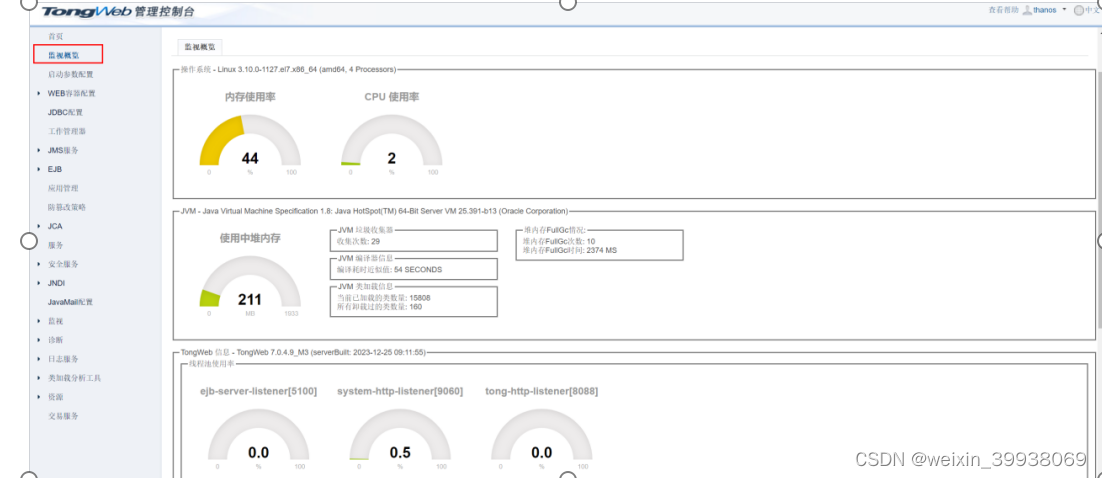
1.优化jvm和openfile相关参数
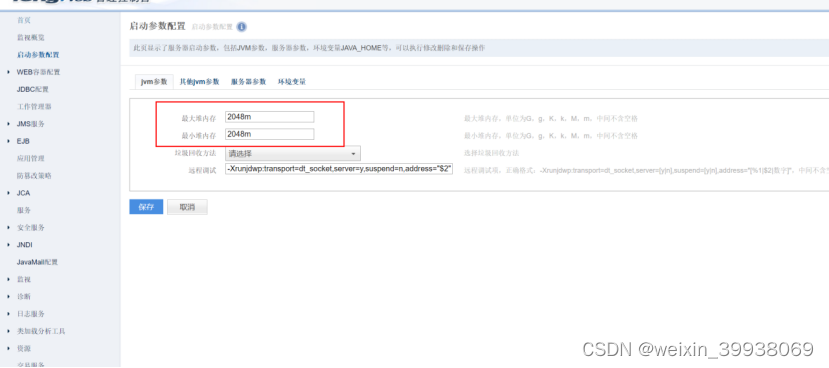
上图是控制台的jvm参数的配置位置,在这里请确保至少2048m(这里配的是xmx和xms参数)。
Openfile(专用机的话请无视这一步):
在服务器上的命令行工具输入:ulimit -a
建议调整为65535,可通过vi /etc/security/limits.conf,添加以下两行:
- soft nofile 65535
- hard nofile 65535
修改完后通过linux系统命令ulimit a查看open files值生效后重启 TongWeb
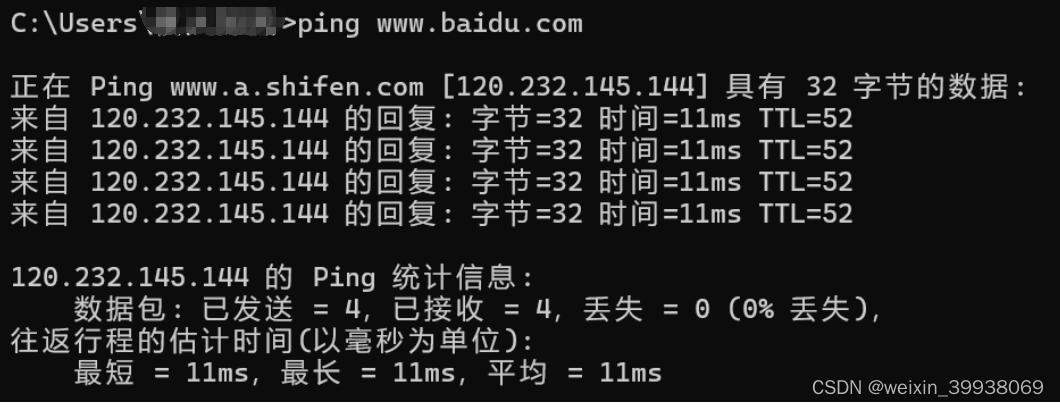
2.排除网络延迟(仅供参考)
可访问服务器ip的电脑上cmd然后ping 域名或者服务器ip:
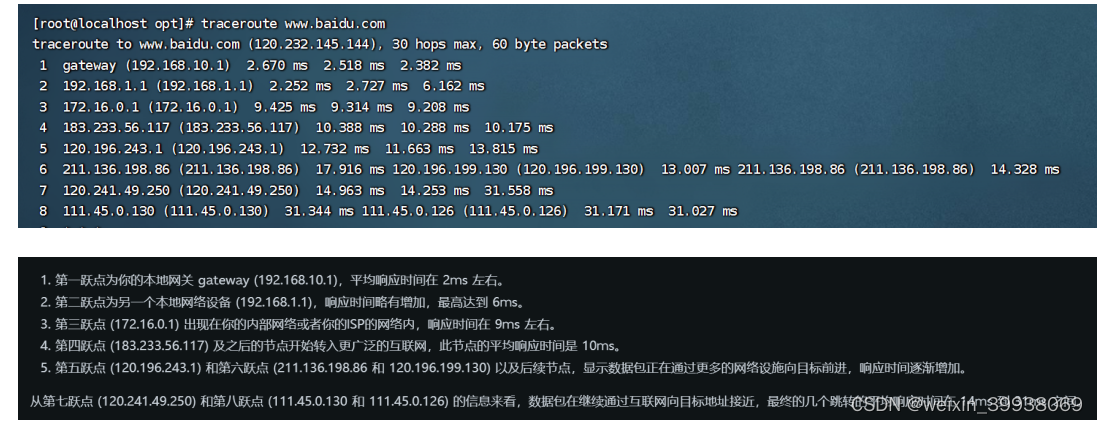
可访问服务器ip的电脑上cmd ,tarcert 域名或者服务器ip

如果应用本身有其他服务器或者ip交互的配置(例如应用a在服务器a上部署,配置的是b服务器上的数据库或者其他中间件),可以尝试使用traceroute 域名或者服务器ip,看看响应时间是否超时或者过长:
3 查看服务器资源的使用情况
3.1查看方式
可以在tongweb的控制台查看
或者在服务器命令行页面执行:
top
然后执行:
1
最后执行:
c
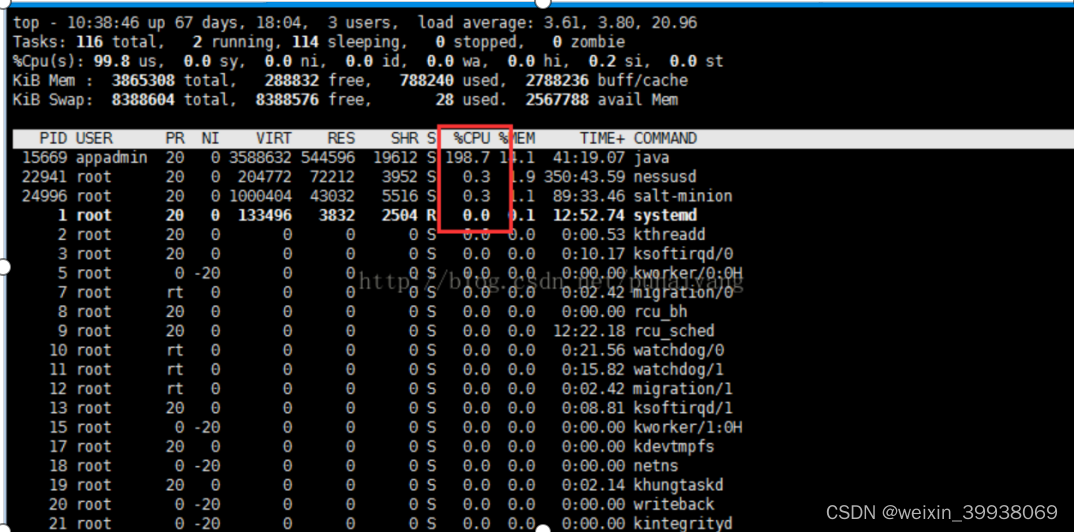
相当于执行了一次top命令,展示当前系统的资源使用情况:
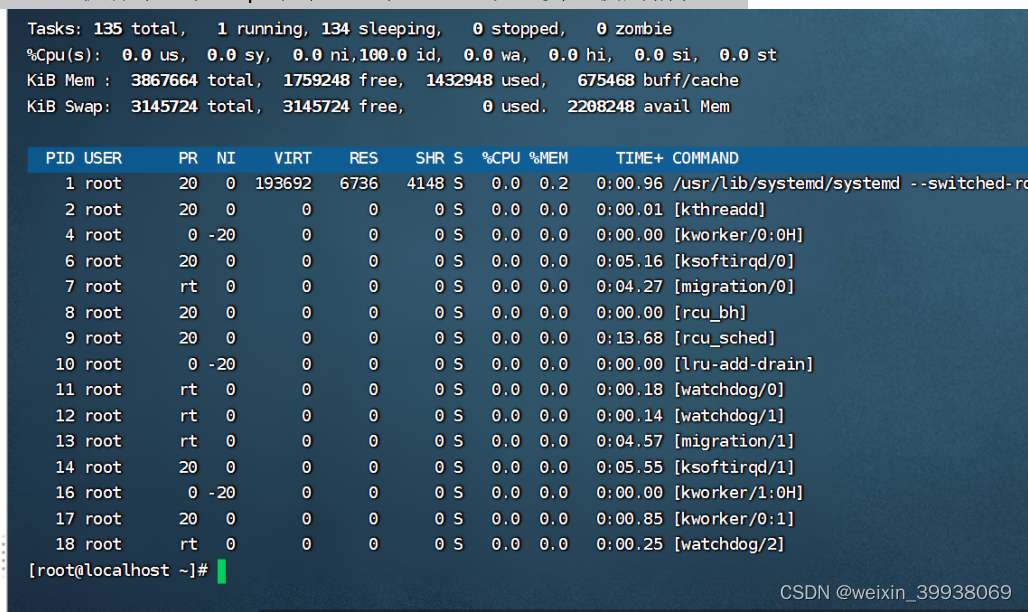
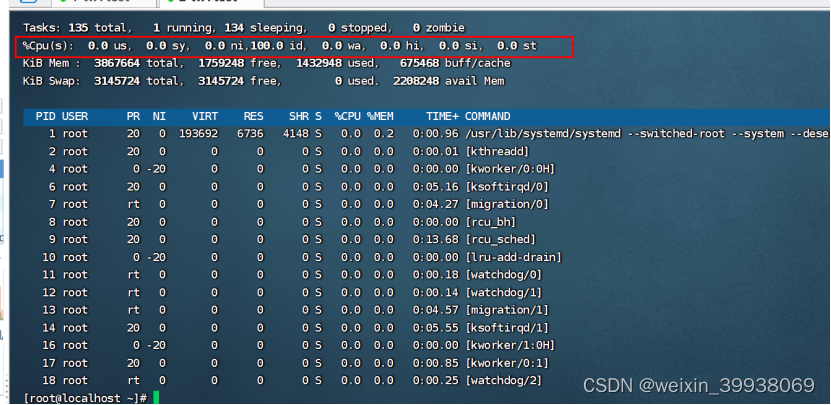

在这里插入图片描述
之后根据查看的结果,主要有以下几种情况:cpu占用过高,内存占用过高,线程阻塞。
3.1.1cpu占用过高
方法1:使用脚本show-busy-java-threads.sh进行分析
以下是脚本的内容,可以自己建一个sh脚本,将内容复制粘贴进去,然后改名为show-busy-java-threads.sh(使用前提:服务器已配置jdk环境变量,支持例如jmap和jstack指令)
#!/bin/bash
# @Function
# Find out the highest cpu consumed threads of java processes, and print the stack of these threads.
#
# @Usage
#   $ ./show-busy-java-threads
#
# @online-doc https://github.com/oldratlee/useful-scripts/blob/master/docs/java.md#-show-busy-java-threads
# @author Jerry Lee (oldratlee at gmail dot com)
# @author superhj1987 (superhj1987 at 126 dot com)readonly PROG="`basename $0`"
readonly -a COMMAND_LINE=("$0" "$@")
# Get current user name via whoami command
#   See https://www.lifewire.com/current-linux-user-whoami-command-3867579
# Because if run command by `sudo -u`, env var $USER is not rewritten/correct, just inherited from outside!
readonly USER="`whoami`"################################################################################
# util functions
################################################################################# NOTE: $'foo' is the escape sequence syntax of bash
readonly ec=$'\033' # escape char
readonly eend=$'\033[0m' # escape endcolorEcho() {local color=$1shift# if stdout is console, turn on color output.[ -t 1 ] && echo "$ec[1;${color}m$@$eend" || echo "$@"
}colorPrint() {local color=$1shiftcolorEcho "$color" "$@"[ -n "$append_file" -a -w "$append_file" ] && echo "$@" >> "$append_file"[ -n "$store_dir" -a -w "$store_dir" ] && echo "$@" >> "${store_file_prefix}$PROG"
}normalPrint() {echo "$@"[ -n "$append_file" -a -w "$append_file" ] && echo "$@" >> "$append_file"[ -n "$store_dir" -a -w "$store_dir" ] && echo "$@" >> "${store_file_prefix}$PROG"
}redPrint() {colorPrint 31 "$@"
}greenPrint() {colorPrint 32 "$@"
}yellowPrint() {colorPrint 33 "$@"
}bluePrint() {colorPrint 36 "$@"
}die() {redPrint "Error: $@" 1>&2exit 1
}logAndRun() {echo "$@"echo"$@"
}logAndCat() {echo "$@"echocat
}usage() {local -r exit_code="$1"shift[ -n "$exit_code" -a "$exit_code" != 0 ] && local -r out=/dev/stderr || local -r out=/dev/stdout(( $# > 0 )) && { echo "$@"; echo; } > $out> $out cat <<EOF
Usage: ${PROG} [OPTION]... [delay [count]]
Find out the highest cpu consumed threads of java processes,
and print the stack of these threads.
Example:${PROG}       # show busy java threads info${PROG} 1     # update every 1 second, (stop by eg: CTRL+C)${PROG} 3 10  # update every 3 seconds, update 10 times
Output control:-p, --pid <java pid>      find out the highest cpu consumed threads fromthe specified java process.default from all java process.-c, --count <num>         set the thread count to show, default is 5.-a, --append-file <file>  specifies the file to append output as log.-S, --store-dir <dir>     specifies the directory for storingthe intermediate files, and keep files.default store intermediate files at tmp dir,and auto remove after run. use this option to keepfiles so as to review jstack/top/ps output later.delay                     the delay between updates in seconds.count                     the number of updates.delay/count arguments imitates the style ofvmstat command.
jstack control:-s, --jstack-path <path>  specifies the path of jstack command.-F, --force               set jstack to force a thread dump. use when jstackdoes not respond (process is hung).-m, --mix-native-frames   set jstack to print both java and native frames(mixed mode).-l, --lock-info           set jstack with long listing.prints additional information about locks.
CPU usage calculation control:-d, --top-delay           specifies the delay between top samples.default is 0.5 (second). get thread cpu percentageduring this delay interval.more info see top -d option. eg: -d 1 (1 second).-P, --use-ps              use ps command to find busy thread(cpu usage)instead of top command.default use top command, because cpu usage ofps command is expressed as the percentage oftime spent running during the *entire lifetime*of a process, this is not ideal in general.
Miscellaneous:-h, --help                display this help and exit.
EOFexit $exit_code
}################################################################################
# Check os support
################################################################################uname | grep '^Linux' -q || die "$PROG only support Linux, not support `uname` yet!"################################################################################
# parse options
################################################################################# NOTE: ARGS can not be declared as readonly!!
# readonly declaration make exit code of assignment to be always 0, aka. the exit code of `getopt` in subshell is discarded.
#   tested on bash 4.2.46
ARGS=`getopt -n "$PROG" -a -o p:c:a:s:S:Pd:Fmlh -l count:,pid:,append-file:,jstack-path:,store-dir:,use-ps,top-delay:,force,mix-native-frames,lock-info,help -- "$@"`
[ $? -ne 0 ] && { echo; usage 1; }
eval set -- "${ARGS}"while true; docase "$1" in-c|--count)count="$2"shift 2;;-p|--pid)pid="$2"shift 2;;-a|--append-file)append_file="$2"shift 2;;-s|--jstack-path)jstack_path="$2"shift 2;;-S|--store-dir)store_dir="$2"shift 2;;-P|--use-ps)use_ps=trueshift;;-d|--top-delay)top_delay="$2"shift 2;;-F|--force)force=-Fshift;;-m|--mix-native-frames)mix_native_frames=-mshift;;-l|--lock-info)more_lock_info=-lshift;;-h|--help)usage;;--)shiftbreak;;esac
donecount=${count:-5}update_delay=${1:-0}
[ -z "$1" ] && update_count=1 || update_count=${2:-0}
(( update_count < 0 )) && update_count=0top_delay=${top_delay:-0.5}
use_ps=${use_ps:-false}# check the directory of append-file(-a) mode, create if not exsit.
if [ -n "$append_file" ]; thenif [ -e "$append_file" ]; then[ -f "$append_file" ] || die "$append_file(specified by option -a, for storing run output files) exists but is not a file!"[ -w "$append_file" ] || die "file $append_file(specified by option -a, for storing run output files) exists but is not writable!"elseappend_file_dir="$(dirname "$append_file")"if [ -e "$append_file_dir" ]; then[ -d "$append_file_dir" ] || die "directory $append_file_dir(specified by option -a, for storing run output files) exists but is not a directory!"[ -w "$append_file_dir" ] || die "directory $append_file_dir(specified by option -a, for storing run output files) exists but is not writable!"elsemkdir -p "$append_file_dir" || die "fail to create directory $append_file_dir(specified by option -a, for storing run output files)!"fifi
fi# check store directory(-S) mode, create directory if not exsit.
if [ -n "$store_dir" ]; thenif [ -e "$store_dir" ]; then[ -d "$store_dir" ] || die "$store_dir(specified by option -S, for storing output files) exists but is not a directory!"[ -w "$store_dir" ] || die "directory $store_dir(specified by option -S, for storing output files) exists but is not writable!"elsemkdir -p "$store_dir" || die "fail to create directory $store_dir(specified by option -S, for storing output files)!"fi
fi################################################################################
# check the existence of jstack command
################################################################################if [ -n "$jstack_path" ]; then[ -f "$jstack_path" ] || die "$jstack_path is NOT found!"[ -x "$jstack_path" ] || die "$jstack_path is NOT executalbe!"
elif which jstack &> /dev/null; thenjstack_path="`which jstack`"
else[ -n "$JAVA_HOME" ] || die "jstack not found on PATH and No JAVA_HOME setting! Use -s option set jstack path manually."[ -f "$JAVA_HOME/bin/jstack" ] || die "jstack not found on PATH and \$JAVA_HOME/bin/jstack($JAVA_HOME/bin/jstack) file does NOT exists! Use -s option set jstack path manually."[ -x "$JAVA_HOME/bin/jstack" ] || die "jstack not found on PATH and \$JAVA_HOME/bin/jstack($JAVA_HOME/bin/jstack) is NOT executalbe! Use -s option set jstack path manually."jstack_path="$JAVA_HOME/bin/jstack"
fi################################################################################
# biz logic
################################################################################readonly run_timestamp="`date "+%Y-%m-%d_%H:%M:%S.%N"`"
readonly uuid="${PROG}_${run_timestamp}_${RANDOM}_$$"readonly tmp_store_dir="/tmp/${uuid}"
if [ -n "$store_dir" ]; thenreadonly store_file_prefix="$store_dir/${run_timestamp}_"
elsereadonly store_file_prefix="$tmp_store_dir/${run_timestamp}_"
fi
mkdir -p "$tmp_store_dir"cleanupWhenExit() {rm -rf "$tmp_store_dir" &> /dev/null
}
trap "cleanupWhenExit" EXITheadInfo() {colorEcho "0;34;42" ================================================================================echo "$(date "+%Y-%m-%d %H:%M:%S.%N") [$(( i + 1 ))/$update_count]: ${COMMAND_LINE[@]}"colorEcho "0;34;42" ================================================================================echo
}if [ -n "${pid}" ]; thenreadonly ps_process_select_options="-p $pid"
elsereadonly ps_process_select_options="-C java -C jsvc"
fi# output field: pid, thread id(lwp), pcpu, user
#   order by pcpu(percentage of cpu usage)
findBusyJavaThreadsByPs() {# 1. sort by %cpu by ps option `--sort -pcpu`# 2. use wide output(unlimited width) by ps option `-ww`#    avoid trunk user column to username_fo+ or $uid alikelocal -a ps_cmd_line=(ps $ps_process_select_options -wwLo pid,lwp,pcpu,user --sort -pcpu --no-headers)local -r ps_out="$("${ps_cmd_line[@]}")"if [ -n "$store_dir" ]; thenecho "$ps_out" | logAndCat "${ps_cmd_line[@]}" > "${store_file_prefix}$(( i + 1 ))_ps"fiecho "$ps_out" | head -n "${count}"
}# top with output field: thread id, %cpu
__top_threadId_cpu() {# 1. sort by %cpu by top option `-o %CPU`#    unfortunately, top version 3.2 does not support -o option(supports from top version 3.3+),#    use#       HOME="$tmp_store_dir" top -H -b -n 1#    combined#       sort#    instead of#       HOME="$tmp_store_dir" top -H -b -n 1 -o '%CPU'# 2. change HOME env var when run top,#    so as to prevent top command output format being change by .toprc user config file unexpectedly# 3. use option `-d 0.5`(update interval 0.5 second) and `-n 2`(update 2 times),#    and use second time update data to get cpu percentage of thread in 0.5 second interval# 4. top v3.3, there is 1 black line between 2 update;#    but top v3.2, there is 2 blank lines between 2 update!local -a top_cmd_line=(top -H -b -d $top_delay -n 2)local -r top_out=$(HOME="$tmp_store_dir" "${top_cmd_line[@]}")if [ -n "$store_dir" ]; thenecho "$top_out" | logAndCat "${top_cmd_line[@]}" > "${store_file_prefix}$(( i + 1 ))_top"fiecho "$top_out" |awk 'BEGIN { blockIndex = 0; currentLineHasText = 0; prevLineHasText = 0; } {currentLineHasText = ($0 != "")if (prevLineHasText && !currentLineHasText)blockIndex++    # from text line to empty line, increase block indexif (blockIndex == 3 && ($NF == "java" || $NF == "jsvc"))   # $NF(last field) is command field# only print 4th text block(blockIndex == 3), aka. process info of second top updateprint $1 " " $9     # $1 is thread id field, $9 is %cpu fieldprevLineHasText = currentLineHasText    # update prevLineHasText}' | sort -k2,2nr
}__complete_pid_user_by_ps() {# ps output field: pid, thread id(lwp), userlocal -a ps_cmd_line=(ps $ps_process_select_options -wwLo pid,lwp,user --no-headers)local -r ps_out="$("${ps_cmd_line[@]}")"if [ -n "$store_dir" ]; thenecho "$ps_out" | logAndCat "${ps_cmd_line[@]}" > "${store_file_prefix}$(( i + 1 ))_ps"filocal idx=0local -a linewhile IFS=" " read -a line ; do(( idx < count )) || breaklocal threadId="${line[0]}"local pcpu="${line[1]}"# output field: pid, threadId, pcpu, userlocal output_fields="$( echo "$ps_out" |awk -v "threadId=$threadId" -v "pcpu=$pcpu" '$2==threadId {printf "%s %s %s %s\n", $1, threadId, pcpu, $3; exit}' )"if [ -n "$output_fields" ]; then(( idx++ ))echo "$output_fields"fidone
}# output format is same as function findBusyJavaThreadsByPs
findBusyJavaThreadsByTop() {__top_threadId_cpu | __complete_pid_user_by_ps
}printStackOfThreads() {local -a linelocal idx=0while IFS=" " read -a line ; dolocal pid="${line[0]}"local threadId="${line[1]}"local threadId0x="0x`printf %x ${threadId}`"local pcpu="${line[2]}"local user="${line[3]}"(( idx++ ))local jstackFile="${store_file_prefix}$(( i + 1 ))_jstack_${pid}"[ -f "${jstackFile}" ] || {local -a jstack_cmd_line=( "$jstack_path" ${force} $mix_native_frames $more_lock_info ${pid} )if [ "${user}" == "${USER}" ]; then# run without sudo, when java process user is current userlogAndRun "${jstack_cmd_line[@]}" > ${jstackFile}elif [ $UID == 0 ]; then# if java process user is not current user, must run jstack with sudologAndRun sudo -u "${user}" "${jstack_cmd_line[@]}" > ${jstackFile}else# current user is not root user, so can not run with sudo; print error message and rerun suggestionredPrint "[$idx] Fail to jstack busy(${pcpu}%) thread(${threadId}/${threadId0x}) stack of java process(${pid}) under user(${user})."redPrint "User of java process($user) is not current user($USER), need sudo to rerun:"yellowPrint "    sudo ${COMMAND_LINE[@]}"normalPrintcontinuefi || {redPrint "[$idx] Fail to jstack busy(${pcpu}%) thread(${threadId}/${threadId0x}) stack of java process(${pid}) under user(${user})."normalPrintrm "${jstackFile}" &> /dev/nullcontinue}}bluePrint "[$idx] Busy(${pcpu}%) thread(${threadId}/${threadId0x}) stack of java process(${pid}) under user(${user}):"if [ -n "$mix_native_frames" ]; thenlocal sed_script="/--------------- $threadId ---------------/,/^---------------/ {/--------------- $threadId ---------------/b # skip first separator line/^---------------/d # delete second separator linep}"elif [ -n "$force" ]; thenlocal sed_script="/^Thread ${threadId}:/,/^$/ {/^$/d; p # delete end separator line}"elselocal sed_script="/ nid=${threadId0x} /,/^$/ {/^$/d; p # delete end separator line}"fi{sed "$sed_script" -n ${jstackFile}echo} | tee ${append_file:+-a "$append_file"} ${store_dir:+-a "${store_file_prefix}$PROG"}done
}################################################################################
# Main
################################################################################main() {local i# if update_count <= 0, infinite loop till user interrupted (eg: CTRL+C)for (( i = 0; update_count <= 0 || i < update_count; ++i )); do(( i > 0 )) && sleep "$update_delay"[ -n "$append_file" -o -n "$store_dir" ] && headInfo | tee ${append_file:+-a "$append_file"} ${store_dir:+-a "${store_file_prefix}$PROG"} > /dev/null(( update_count != 1 )) && headInfoif $use_ps; thenfindBusyJavaThreadsByPselsefindBusyJavaThreadsByTopfi | printStackOfThreadsdone
}main
使用指引:
先给该文件授权:
chmod +x show-busy-java-threads.sh 或
chmod 777 show-busy-java-threads.sh
然后执行:
./ show-busy-java-threads.sh -a /opt/xxx.txt 或者sh show-busy-java-threads.sh -a /opt/xxx.txt
这个指令会将查出来的结果输出位xx.txt文件输出到opt目录下,方便后面追踪。
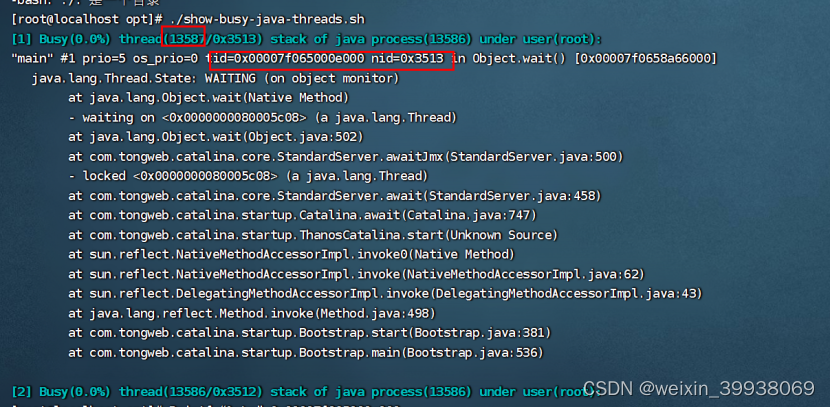
主要看 Busy里的占比,看看有没有占比比较高的,以及busy里较高的日志信息,有没有相关提示,详细可参考:
how-busy-java-threads脚本初体验,快速排查Java的CPU性能问题
方法2:使用jstack
参考:
记一次java程序CPU占用过高问题排查
大致思路:
top查一下系统资源占用情况,找出pid
或者也可以跟之前一样,通过监听9060端口和jps指令确认tongweb进程,拿到tongweb的pid
通过这个指令看一下占用和tid:
ps -mp pid -o THREAD,tid,time
找到tid后,通过指令得到16位进制的数字(方便之后使用)
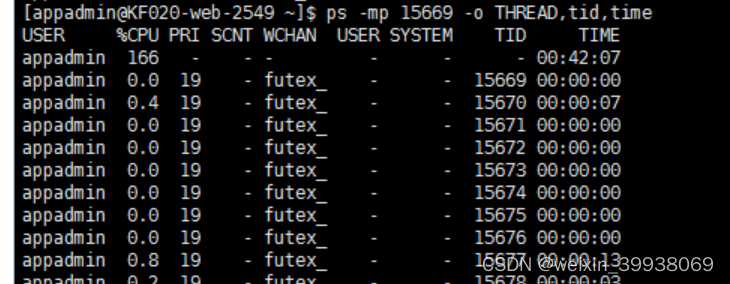
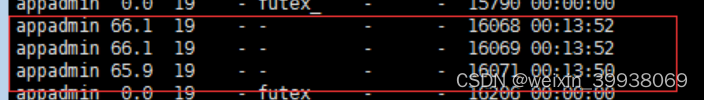
printf “%x\n” tid
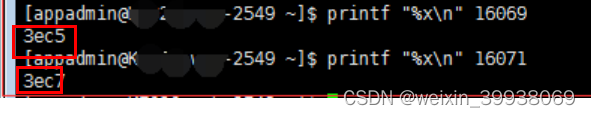
之后拿找到的pid和tid转换过来的数字,进行精确定位(红色框第一个是pid,第二个是tid转换过来的数字):
jstack pid |grep tid转换的十六位进制数字
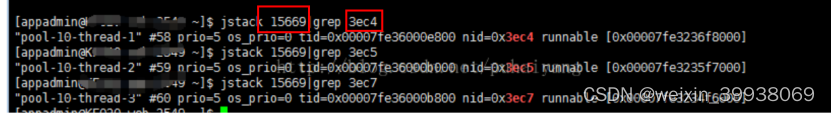
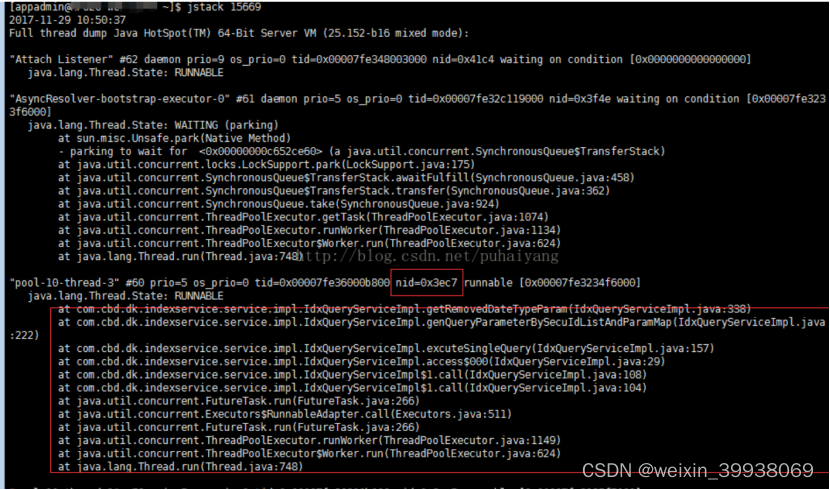
其中显示出了较为详细的代码信息
另外为了方便追踪,也可以执行:
jstack pid |grep tid转换的数字 > /opt/jstack.txt
上面显示的内容会存入到jstack.txt里面,然后把这个文件交给开发,让开发来排查一下是否是应用代码层面的问题。
3.1.2内存占用过高
这种现象通常是TongWeb控制台和应用访部都很慢,日志中有“OutOfMemoryError:Java
heap space”,就跟前面说的“死”一样,但进程还在。通过查看bin下gc.log日志,或通过jstat
命令,查看内存是否占满,Full GC是否频繁。
首先,请参考tw7配置gc日志和阈值
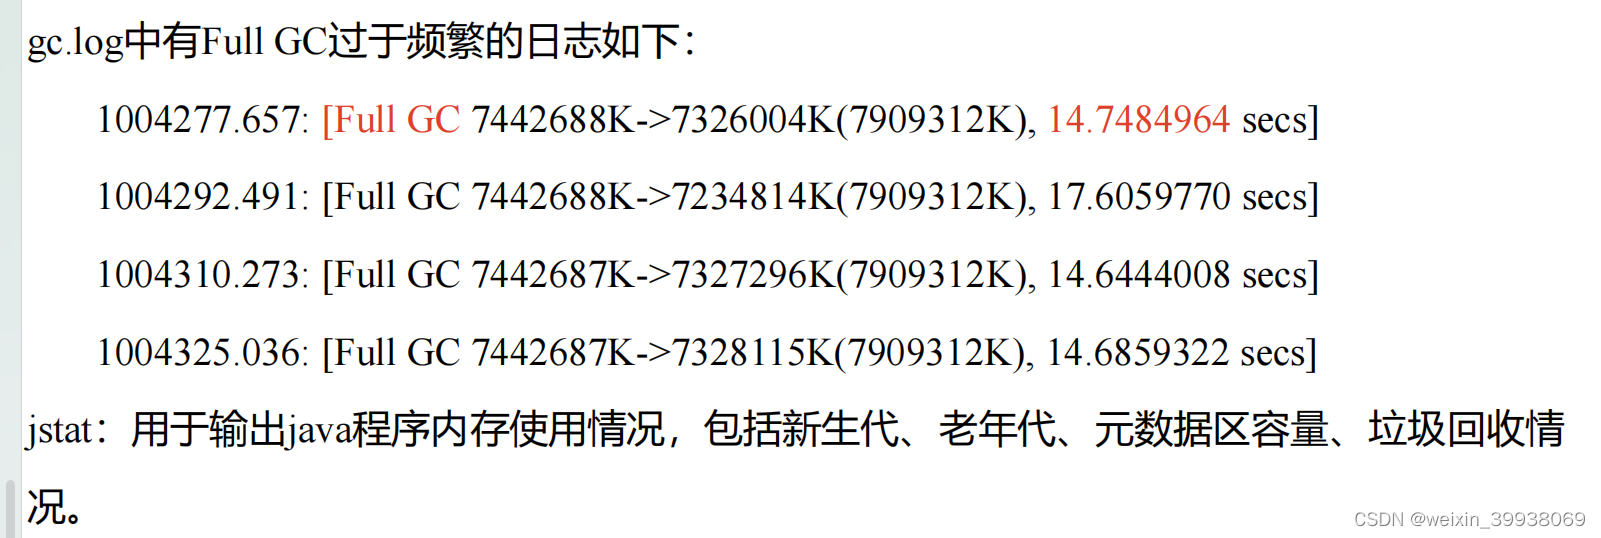
可执行
jstat gcutil 进程号 2000 20
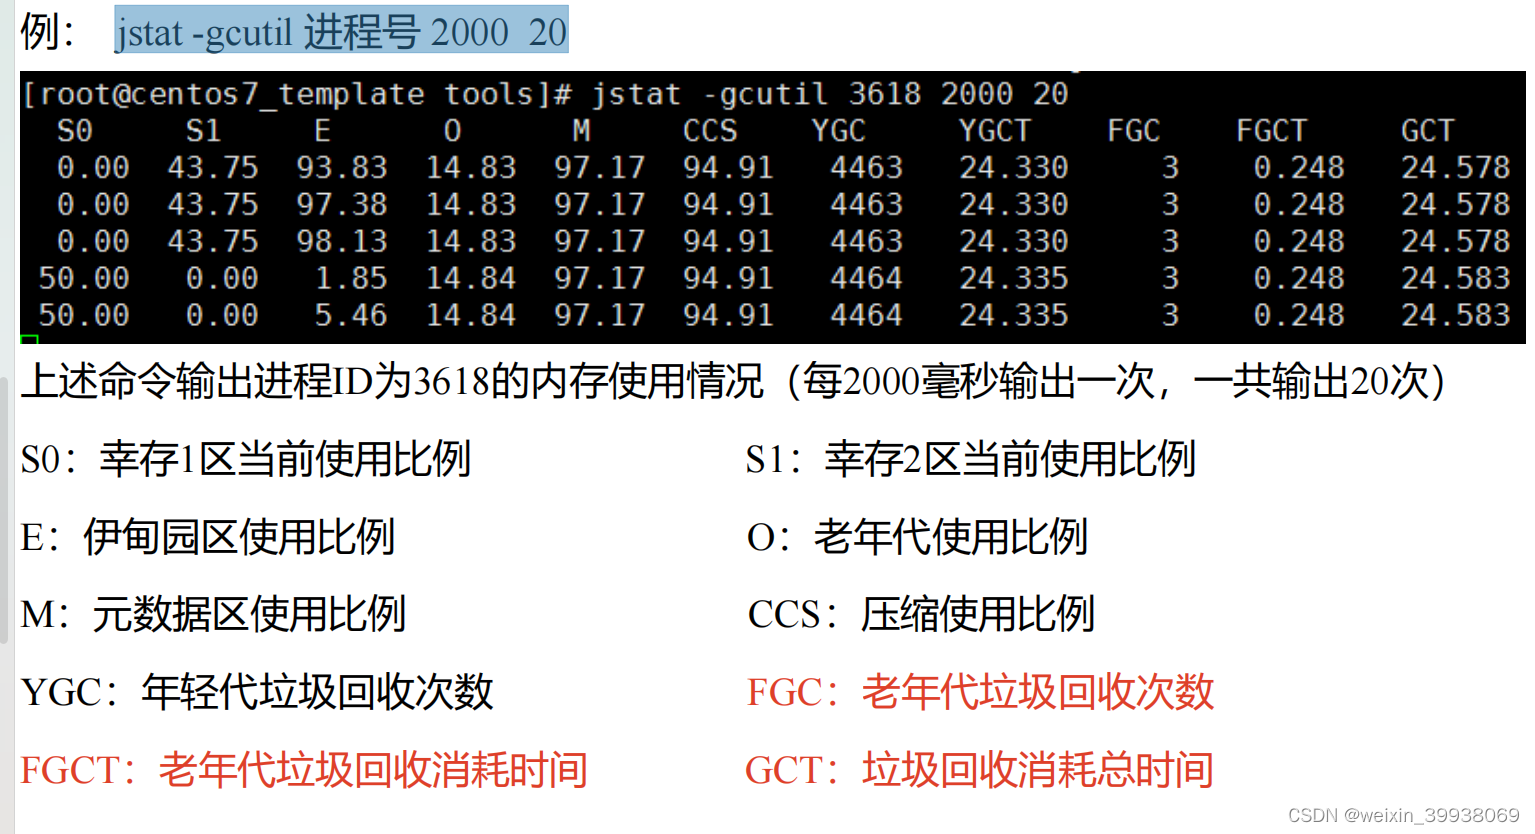
当 确认内存满了,执行以下操作:
(1) 要求出现OutOfMemoryError:Java heap space时不要重启Java进程,保留进程继续执行如
下操作。
(2) 利用JDK的jps –v命令查出Java的进程号(或者查看一下tongwbe的进程id)。
(3) 通过jmap –histo > mem.txt 打出文本日志,生成过程很快,文件很小。
(4) 采用jmap生成完整的内存镜像文件
jmap -dump:format=b,file=/opt/heap.hprof <PID>
或
jmap dump:live,format=b,file=heap.bin <PID>
在当前执行命令目录下生成,如果内存设为2G,则生成的内存镜像文件也有2G。
(5) 生成的mem.txt文件可以用文本工具打开直接看,内存镜像文件可以用MemoryAnalyzer内
存分析工具分析。下载地址如: http://www.eclipse.org/mat。 分析这些文件需要用大内存机
器才行,建议用64位windows机器,安装64位MemoryAnalyzer软件,物理内存至少为内存镜
像文件的3倍。
MemoryAnalyzer使用指引参考:
【JVM】日志分析工具一Memory Analyzer Mat介绍和使用
tongweb生成hprof文件并结合Memory Analyzer Mat分析内存溢出
3.1.1线程阻塞
这种现象通常表现为CPU使用不高,TongWeb控制台访问正常,但应用所有页面访问都慢,这种情况通常是应用的http线程池出现阻塞导致的。
出现这种问题时可使用JDK的jstack命令打出线程栈来分析。 如:jstack <java进程id> > log.txt, 输出到指定文件。
重点看是不是BLOCKED线程很多,这些线程是不是lock在同一地址上, 偶尔几个BLOCKED线程对系统不影响。
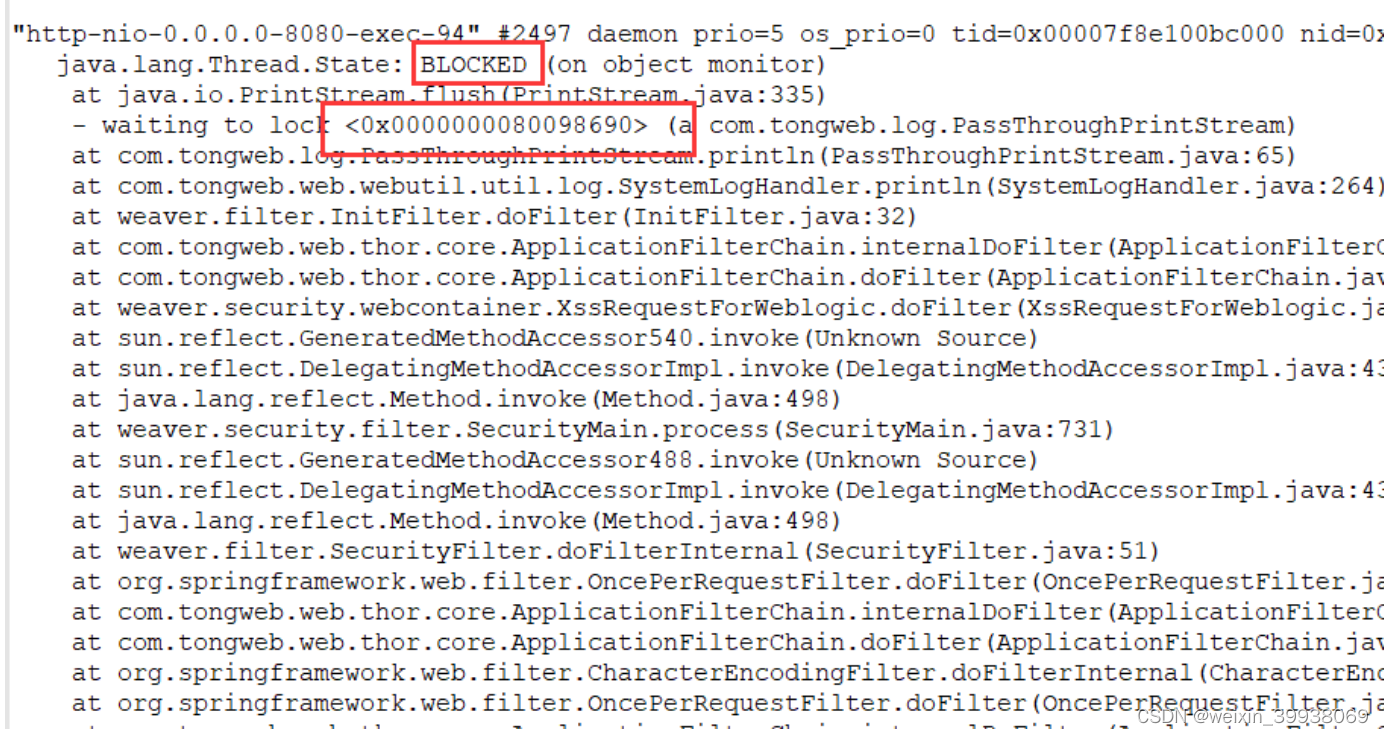
如果多次出现这种提示,最好将打印出的文件发给开发来进行排查。
3 数据源原因
这种现象通常表现为CPU使用不高,TongWeb控制台访问正常,但应用跟数据库无关的页面访问正常,跟数据库有关的页面访问慢。这种分种情况:
(1). 数据源连接池占满,TongWeb的server.log中可以看到数据源占满的日志(开源和
TongWeb数据源都会有),通过jstack可以看到线程阻塞在数据源上。可能是连接数过小引起的,若加大后还出现就有可能是存在连接泄露问题了,找应用代码泄露的地方改掉。 改不了应用代码就把“泄漏超时”“泄漏回收”同时设置上,这样到达超时时间后,强制回收数据库连接。开源连接池也有这参数。
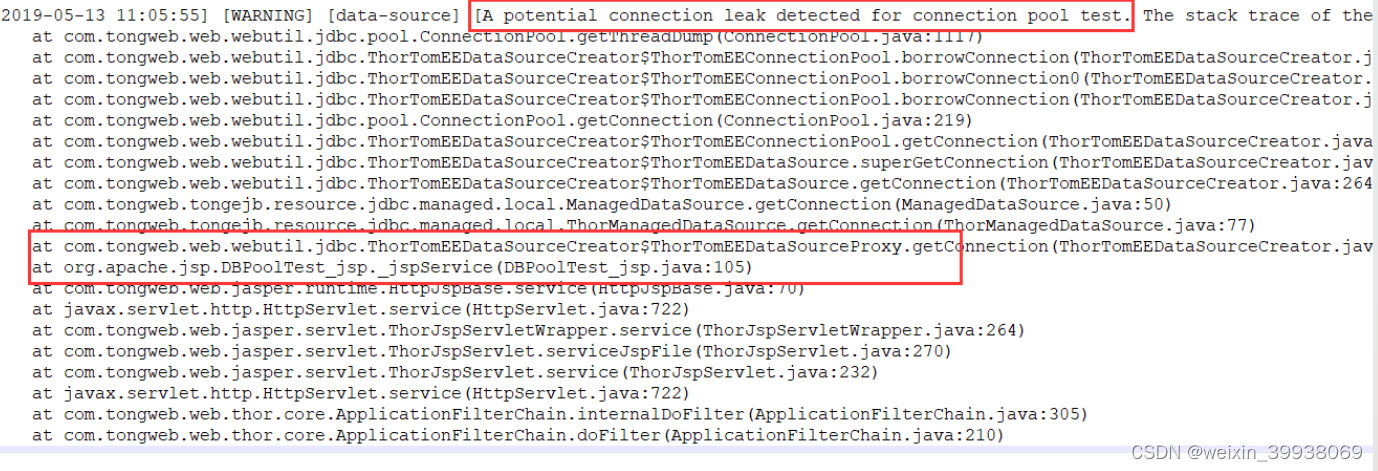
(2).查看慢sql日志,优化慢sql语句。
4.应用代码层面
1.可记录下应用卡顿的场景,看看应用对应场景的代码,是否设置超时时间(设置过长的超时时间,或者没有设置超时时间,都有可能导致卡顿甚至没有响应)。
2.应用代码里有System.exit(0)代码(找出应用代码用System.exit的地方并删掉,或者启动参数加入-Djava.security.manager)。
3.使用jstack指令(前面章节有介绍)进行排查。
4.查看日志,例如tongweb的安装目录的logs目录下的日志文件(例如:server.log)。
5.看看应用是否存在重复的类,冲突的jar包和代码。
5.查看并杀掉僵尸进程(仅供参考)
参考:【Linux】如何杀掉defunct进程-僵尸进程