Vue实现柱状图横向自动滚动
- 1. 前言
- 2. 代码
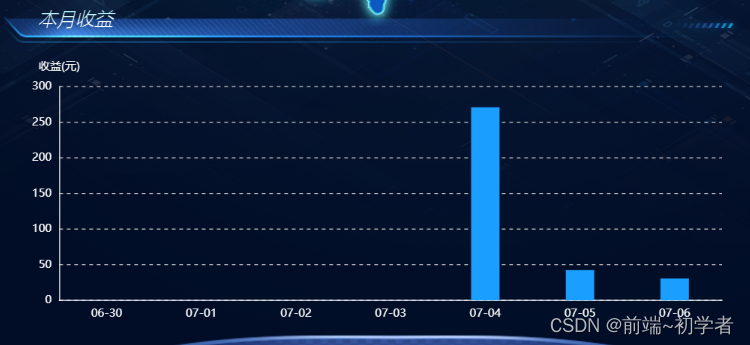
- 3、实现效果图
1. 前言
原理:通过定时器修改Echarts的配置(options)达到我们想要的效果。
此外,我们还需要了解Echarts中dataZoom这个组件,这个组件用于:用于区域缩放,从而能自由关注细节的数据信息,或者概览数据整体,或者去除离群点的影响。简单来说就是,在数据量多的时候,既能保持Echarts美观度,也能让用户自由查看所有数据。
在dataZoom组件中有三种类型,在本次需求中,使用的是内置型数据区域缩放组件(dataZoomInside)。
2. 代码
<script>
export default {data() {return {time: ['06-27', '06-28', '06-29', '06-30', '07-01', '07-02', '07-03', '07-04', '07-05', '07-06', '07-07', '07-08', '07-09', '07-10', '07-11', '07-12', '07-13', '07-14', '07-15', '07-16', '07-17', '07-18', '07-19', '07-20', '07-21', '07-22', '07-23', '07-24', '07-25', '07-26'],income:  [383251.478, 0, 0, 0, 0, 0, 0, 270.992, 42.411, 30.737, 0, 0, 0, 371.994, 218.245, 0, 73.898, 86.697, 0, 108.093, 0, 270.528, 0, 0, 0, 0, 0, 271.527, 0, 0],};},mounted() {// 初始化this.drawIncomeEcharts();},methods: {drawIncomeEcharts () {let that = thisvar chartDom = document.getElementById('income-echarts')var myChart = echarts.init(chartDom)var optionoption = {xAxis: {type: 'category',axisTick: {show: false},data: that.time,axisLabel: {textStyle: {color: '#fff',//坐标值得具体的颜色}},splitLine: {show: false     //去掉网格线},axisLine: {lineStyle: {type: 'solid',color: '#fff', //左边线的颜色                        width: '1' //坐标线的宽度                    }},},yAxis: {name: '收益(元)',type: 'value',axisTick: {show: false},splitLine: {// show: false,lineStyle: {type: 'dashed' //设置网格线类型 dotted:虚线 solid:实线},},axisLabel: {textStyle: {color: '#fff',//坐标值得具体的颜色}},axisLine: {lineStyle: {type: 'solid',color: '#fff', //左边线的颜色                        width: '1' //坐标线的宽度                    }},},tooltip: {trigger: 'axis',},dataZoom: [{xAxisIndex: 0, 	//这里是从X轴的0刻度开始show: false, 	//是否显示滑动条,本次需求中,设置为falsetype: "inside", // 类型:内置型数据区域缩放组件startValue: 0, 	// 从头开始。endValue: 6, 	// 一次性展示几个。},],grid: {left: '4%',top: '15%',right: '4%',bottom: '5%',containLabel: true},series: [{name: '收益(元)',type: 'bar',barWidth: "30%", // 柱子宽度核心代码data: that.income,itemStyle: {color: '#1A9EFF'}}]}setInterval(function () {// 每次向左滑动一个,最后一个从头开始。if (option.dataZoom[0].endValue == income.length) {option.dataZoom[0].startValue = 0option.dataZoom[0].endValue = 6} else {option.dataZoom[0].endValue = option.dataZoom[0].endValue + 1option.dataZoom[0].startValue = option.dataZoom[0].startValue + 1}myChart.setOption(option)}, 2000)option && myChart.setOption(option)window.addEventListener('resize', () => {myChart.resize()})},}
}</script>
3、实现效果图