OSWatcher.sh脚本位于oswbb目录下(Oracle 19c数据库中脚本的路径是:
/u01/app/oracle/product/19.0.0/dbhome_1/suptools/tfa/release/tfa_home/ext/oswbb/),由脚本startOSWbb.sh和stopOSWbb.sh来调用启动和停止它。
1. startOSWbb.sh脚本和stopOSWbb.sh脚本
startOSWbb.sh脚本有4个参数,如下所示:
# $1 = snapshot interval in seconds.
# $2 = the number of hours of archive data to store.
# $3 = (optional) the name of the zip or compress utility you want
#      OSWbb to use to zip up the archive files upon completion. If
#      no zipping is desired set this parameter = NONE. This will
#      allow for the $4 parameter below to be recognized as both $3
#      and $4 are optional parameters.
# $4 = (optional) the fully qualified name of the archive directory
#      where you want oswbb to save your data. This option can be used
#      instead of setting the UNIX environment variable OSWBB_ARCHIVE_DEST
#      If this parameter is not set oswbb will look for the UNIX
#      environment variable OSWBB_ARCHIVE_DEST. If neither are set
#      the archive directory will remain in the default location under
#      the oswbb directory./OSWatcher.sh $1 $2 $3 $4 &
第1个参数$1指定快照的时间间隔,即每隔$1秒就采样一次数据,默认值是30秒
第2个参数$2指定保存的每小时的归档数据的数量,即只保存最近的$2小时的数据,默认是48小时
第3个参数$3指定用来压缩归档文件的工具名称
第4个参数$4指定存储数据的归档目录,也可以直接设置OSWBB_ARCHIVE_DEST环境变量来指定该目录,默认是当前目录下的archive目录
如下示例每隔60秒采样一次数据,只保存最近24小时的采样数据,使用gzip对每小时采集的数据进行压缩,数据存放在/u01/dump/archive目录下:
./startOSWbb.sh 60 24 gzip /u01/dump/archive
停止OSWatcher的脚本:
./stopOSWbb.sh
2. 文件管理脚本OSWatcherFM.sh
脚本OSWatcher.sh启动时,会调用文件清理脚本OSWatcherFM.sh在后台对采集的每小时的数据文件进行管理。
./OSWatcherFM.sh $archiveInterval $OSWBB_ARCHIVE_DEST &
OSWatcherFM.sh脚本每分钟扫描一次收集的数据文件的数量,删除超过startOSWbb.sh脚本参数$3指定时间(默认48小时)的数据。
numberOfFiles=`ls -t $2/oswtop | wc -l`
numberToDelete=`expr $numberOfFiles - $archiveInterval`
if [ $numberOfFiles -gt $archiveInterval ]thenls -t $2/oswtop/* | tail -$numberToDelete | xargs rm
fi
3. OSWatcher.sh脚本
OSWatcher.sh脚本每隔startOSWbb.sh脚本参数$1指定的快照时间间隔执行一次采样数据的命令,如下所示:
until test 0 -eq 1
do
echo "oswbb heartbeat:"`date`hour=`date +'%y.%m.%d.%H00.dat'# VMSTAT# MPSTAT# NETSTAT# IOSTAT# LINUX NFS IOSTAT# IFCONFIG# TOP# PS -ELF# Additional Linux Only Collection##./oswsub.sh $OSWBB_ARCHIVE_DEST/oswmeminfo/${hostn}_meminfo_$hour "$MEMINFO" $oswgCompliance &##./oswsub.sh $OSWBB_ARCHIVE_DEST/oswslabinfo/${hostn}_slabinfo_$hour "$SLABINFO" $oswgCompliance &# EXADATA# Run traceroute for private networks if file private.net exists# Run any extra commands in file extras.txt if that file existslasthour=$hoursleep $snapshotInterval
done
其中在Linux系统中采集数据的主要命令如下:
case $PLATFORM inLinux)IOSTAT='iostat -xk 1 3'NFSSTAT='iostat -nk 1 3'VMSTAT='vmstat 1 3'TOP='eval top -b -n 1 | head -50'PSELF='ps -elf'MPSTAT='mpstat -P ALL 1 2'MEMINFO='cat /proc/meminfo'SLABINFO='cat /proc/slabinfo'IFCONFIG='ifconfig -a'TRACERT="traceroute $loopback"另外,可以在oswbb目录下自定义一个extras.txt文件,将要采集数据的脚本写在该文件中。OSWatcher.sh脚本读取和执行extras.txt文件中的脚本的代码如下:
if [ -f extras.txt ]; then
q=1
exec 9<&0 < extras.txt
while read myline
doxshell=`echo $myline | awk '{print $1}'`xcmd=`echo $myline | awk '{print $2}'`xdir=`echo $myline | awk '{print $3}'`xparm1=`echo $myline | awk '{print $4}'`xparm2=`echo $myline | awk '{print $5}'`xparm3=`echo $myline | awk '{print $6}'`xparm4=`echo $myline | awk '{print $7}'`xparm5=`echo $myline | awk '{print $8}'`if [ -n "$xshell" ]; thenif [ $xshell != "#" ]; theneval array$q=$qeval xshell$q=$xshelleval xcmd$q=$xcmdeval xdir$q=$xdir#     Create log subdirectories if they don't exist.if [ ! -d $OSWBB_ARCHIVE_DEST/$xdir ]; thenmkdir -p $OSWBB_ARCHIVE_DEST/$xdirfieval xparm1$q=$xparm1eval xparm2$q=$xparm2eval xparm3$q=$xparm3eval xparm4$q=$xparm4eval xparm5$q=$xparm5qMax=$qq=`expr $q + 1`fifidone
exec 0<&9 9<&-######################################################################
# Run any extra commands in file extras.txt if that file exists
######################################################################
if [ $qMax -gt $ZERO ]; then
a=1while [ "$a" -le "$qMax" ]
doif [ $hour != $lasthour ]; thenecho $PLATFORM OSWbb $version  >> $OSWBB_ARCHIVE_DEST/`eval echo '$xdir'$a`/${hostn}_`eval echo '$xcmd'$a`_$hourif [ $zipfiles = 1 ]; thenif [ -f  $OSWBB_ARCHIVE_DEST/`eval echo  '$xdir'$a`/${hostn}_`eval echo  '$xcmd'$a`_$lasthour ]; then$zip $OSWBB_ARCHIVE_DEST/`eval echo  '$xdir'$a`/${hostn}_`eval echo  '$xcmd'$a`_$lasthour &fififi./`eval echo  '$xshell'$a` $OSWBB_ARCHIVE_DEST/`eval echo  '$xdir'$a`/${hostn}_`eval echo  '$xcmd'$a`_$hour &a=`expr $a + 1`donefi
4. 解析OSWatcher.sh脚本采集的数据生成图形
可以利用oswbb目录下的jar包oswbba.jar对采集的数据进行解析,生成图形和分析数据。
# xdpyinfo
name of diplay: :0
# export DISPLAY=:0
# java -jar oswbba.jar -i /u01/app/grid/tfa/repository/suptools/rac1/oswbb/grid/archive
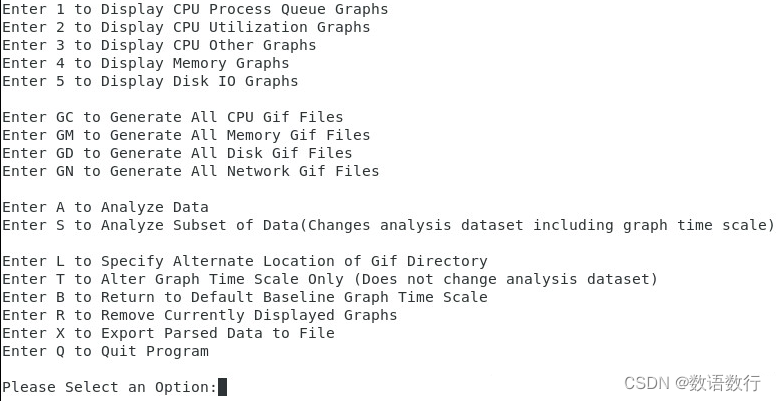
生成的分析数据文件analysis.txt中的信息比较全面,主要内容如下:
############################################################################
# Contents Of This Report:
#
# Section 1: System Status
# Section 2: System Slowdowns
#   Section 2.1: System Slowdown RCA Process Level Ordered By Impact
# Section 3: System General Findings
# Section 4: CPU Detailed Findings
#   Section 4.1: CPU Run Queue:
#   Section 4.2: CPU Utilization: Percent Busy
#   Section 4.3: CPU Utilization: Percent Sys
# Section 5: Memory Detailed Findings
#   Section 5.1: Memory: Process Swap Queue
#   Section 5.2: Memory: Scan Rate
#   Section 5.3  Memory: Page In:
#   Section 5.4  Memory: Page Out:
#   Section 5.5  Memory: Page Tables (Linux only):
#   Section 5.6: Top 5 Memory Consuming Processes Beginning
#   Section 5.7: Top 5 Memory Consuming Processes Ending
# Section 6: Disk Detailed Findings
#   Section 6.1: Disk Percent Utilization Findings
#   Section 6.2: Disk Service Times Findings
#   Section 6.3: Disk Wait Queue Times Findings
#   Section 6.4: Disk Throughput Findings
#   Section 6.5: Disk Reads Per Second
#   Section 6.6: Disk Writes Per Second
#   Section 6.7: Disk Percent CPU waiting on I/O
# Section 7: Network Detailed Findings
#   Section 7.1  Network Data Link Findings
#   Section 7.2: Network IP Findings
#   Section 7.3: Network UDP Findings
#   Section 7.4: Network TCP Findings
# Section 8: Process Detailed Findings
#   Section 8.1: PS Process Summary Ordered By Time
#   Section 8.2: PS for Processes With Status = D or T Ordered By Time
#   Section 8.3: PS for (Processes with CPU > 0) When System Idle CPU < 30% Ordered By Time
#   Section 8.4: Top VSZ Processes Increasing Memory Per Snapshot
#   Section 8.5: Top RSS Processes Increasing Memory Per Snapshot