好久没有在CSDN上发文章了,快一年了吧。这两天重新登录了一下,不看不知道,一看吓一跳,没想到访问量快13万了。
之前写博客的时候,想着把一些有用的东西写下来,一方面是当做笔记了,免得以后忘记了;另外一方面是分享用。可是后来没想到,CSDN首页上的越来越多的标题党文章,没有一点营养,所以就愈发觉得厌恶。慢慢的就没有继续发文章了。虽然CSDN上好久没发文章了,但其实我还是坚持在写技术博客的,不过主要都是发到了自己的博客网站上去,这一年多写了40万字了。
好久没有登录CSDN了,今天登录突然看到访问量一下从几千变成13万了,还是颇感欣慰的。相比于没意思的标题党文章,我觉得还是更加有知识的文章才更加有用。脑子里装着有用的知识总比装着垃圾要好。
所以想想未来还是同步一下两边的文章吧。首先我自己的博客特意没有做Google和百度SEO,免得流量被打爆了。所以以后CSDN上只发文章,不准备引流到我的博客网站。其次,未来准备发的东西的话,先把这一年写的上百篇文章慢慢同步,然后看情况再看看要写些什么技术博客。
目前就说这么多吧,下面就是这篇新的文章。我在后台看我的A算法实现的那个文章阅读量很高,但其实那个文章实现的不是很好,开销比较大。所以这次就把后来我重复实现的A算法的文章上传吧。
本文主要提供了Python版本的A*路径规划算法实现,并在此基础上提供了命令行和基于Matplotlib的GUI用户界面(User Interface)

A*算法-Python实现
路径规划算法是计算机届中非常重要的算法,在不少领域都能够看到路径规划算法的应用,最直接的应用例如打车软件为你规划出路径、迷宫问题的求解等等;而复杂一些的、不直接的应用如六自由度机械臂在空间中运动轨迹的规划可以看做是在六维空间的路径规划、火星车在火星表面的探索等等都可以视为路径规划问题,从而使用路径规划算法进行求解。
路径规划算法大体上可以分为两类:静态路径规划以及动态路径规划。所谓静态静态路径规划指的是提前已知全局地图的前提下进行路径规划;而动态路径规划则指的是预先并不知道全局地图或者仅知道全局地图的一部分,在此基础上对全局地图进行探索的同时动态的利用获取到的信息指导路径规划,最终达到终点。在我们的认知上,一般当然是动态路径规划算法会好很多,因为我们往往并不知道全局地图,而且对于我们人类来说,在一个陌生环境下进行路径规划、到达终点更是我们所希望的。然而在现实中在一些场景中确实全局地图是可以提前获得的,因此针对这些场景,开发出来资源占用更少、速度更快、路径更优的算法就还是有必要的。
其实动态路径规划更进一步,在探索的构建出来全局地图,那就成了SLAM问题了,即同时定位与建图(Simultaneous Localization And Mapping,SLAM)。关于SLAM本文就不再深入了。
本文将要介绍的A*算法就是属于静态路径规划算法的其中一种。在诸多的静态路径规划算法里,A*算法可以和暴力搜索(广度优先、深度优先)一样,获得最优的路径,并且资源消耗远远小于广度优先和深度优先。因此有广泛的应用。
本文将在介绍A*算法的基础上提供一种A*算法的Python实现,并在此基础上讲解实现的代码
0. 前言
其实我现在是一个大二的计算机系学生,最近数据结构课程的配套实验要求学生从十四个题中选择四个来做。本篇博客就是对应的迷宫问题的求解代码。求解问题比较简单,但是这样就太没有意思了,所以在实现文本字符的迷宫求解基础上,我想为自己带来一些挑战,增加一些趣味性与难度。
因此在基础的求解迷宫问题的要求上,我利用Matplotlib中的Interactive Plotting Method将路径规划的过程以GUI的形式表达出来,并在此基础上提供地图绘制、地图保存等一系列功能,最后完成一个不错的程序。
1. A*算法
其实关于A*算法并没有什么好说的,网上不少博客对A*算法都有了非常深入的介绍,因此我这里就不在赘述了,避免班门弄斧。
而对于A*算法,需要理解的关键之处就是在启发值的运用。启发值描述了当前点到终点的估计距离,因此相比于深度有限和广度优先,A*算法每次都会去寻找离终点距离比较近的点作为下一个点,从而避免了漫无目的、低效率的遍历。
此外,算法中的OpenList和CloseList其实指的就是已探索区域的边缘和已经探索区域的内部,因此每次进行下一次探索的时候从OpenList里面找出来点作为下一个探索的点即可。而一旦这个点被探索完毕,将其加入到CloseList中即可,即表示当前点已经被考虑过。
最后算法的结束条件就是当终点已经在CloseList中了,表示已经找到了一条路径,此时对CloseList中的点进行回溯即可找到路径,因为CloseList中的探索区域已经蕴含了路径的信息;此外还要注意找不到路径时候的结束条件,避免找不到路径而陷入死循环。
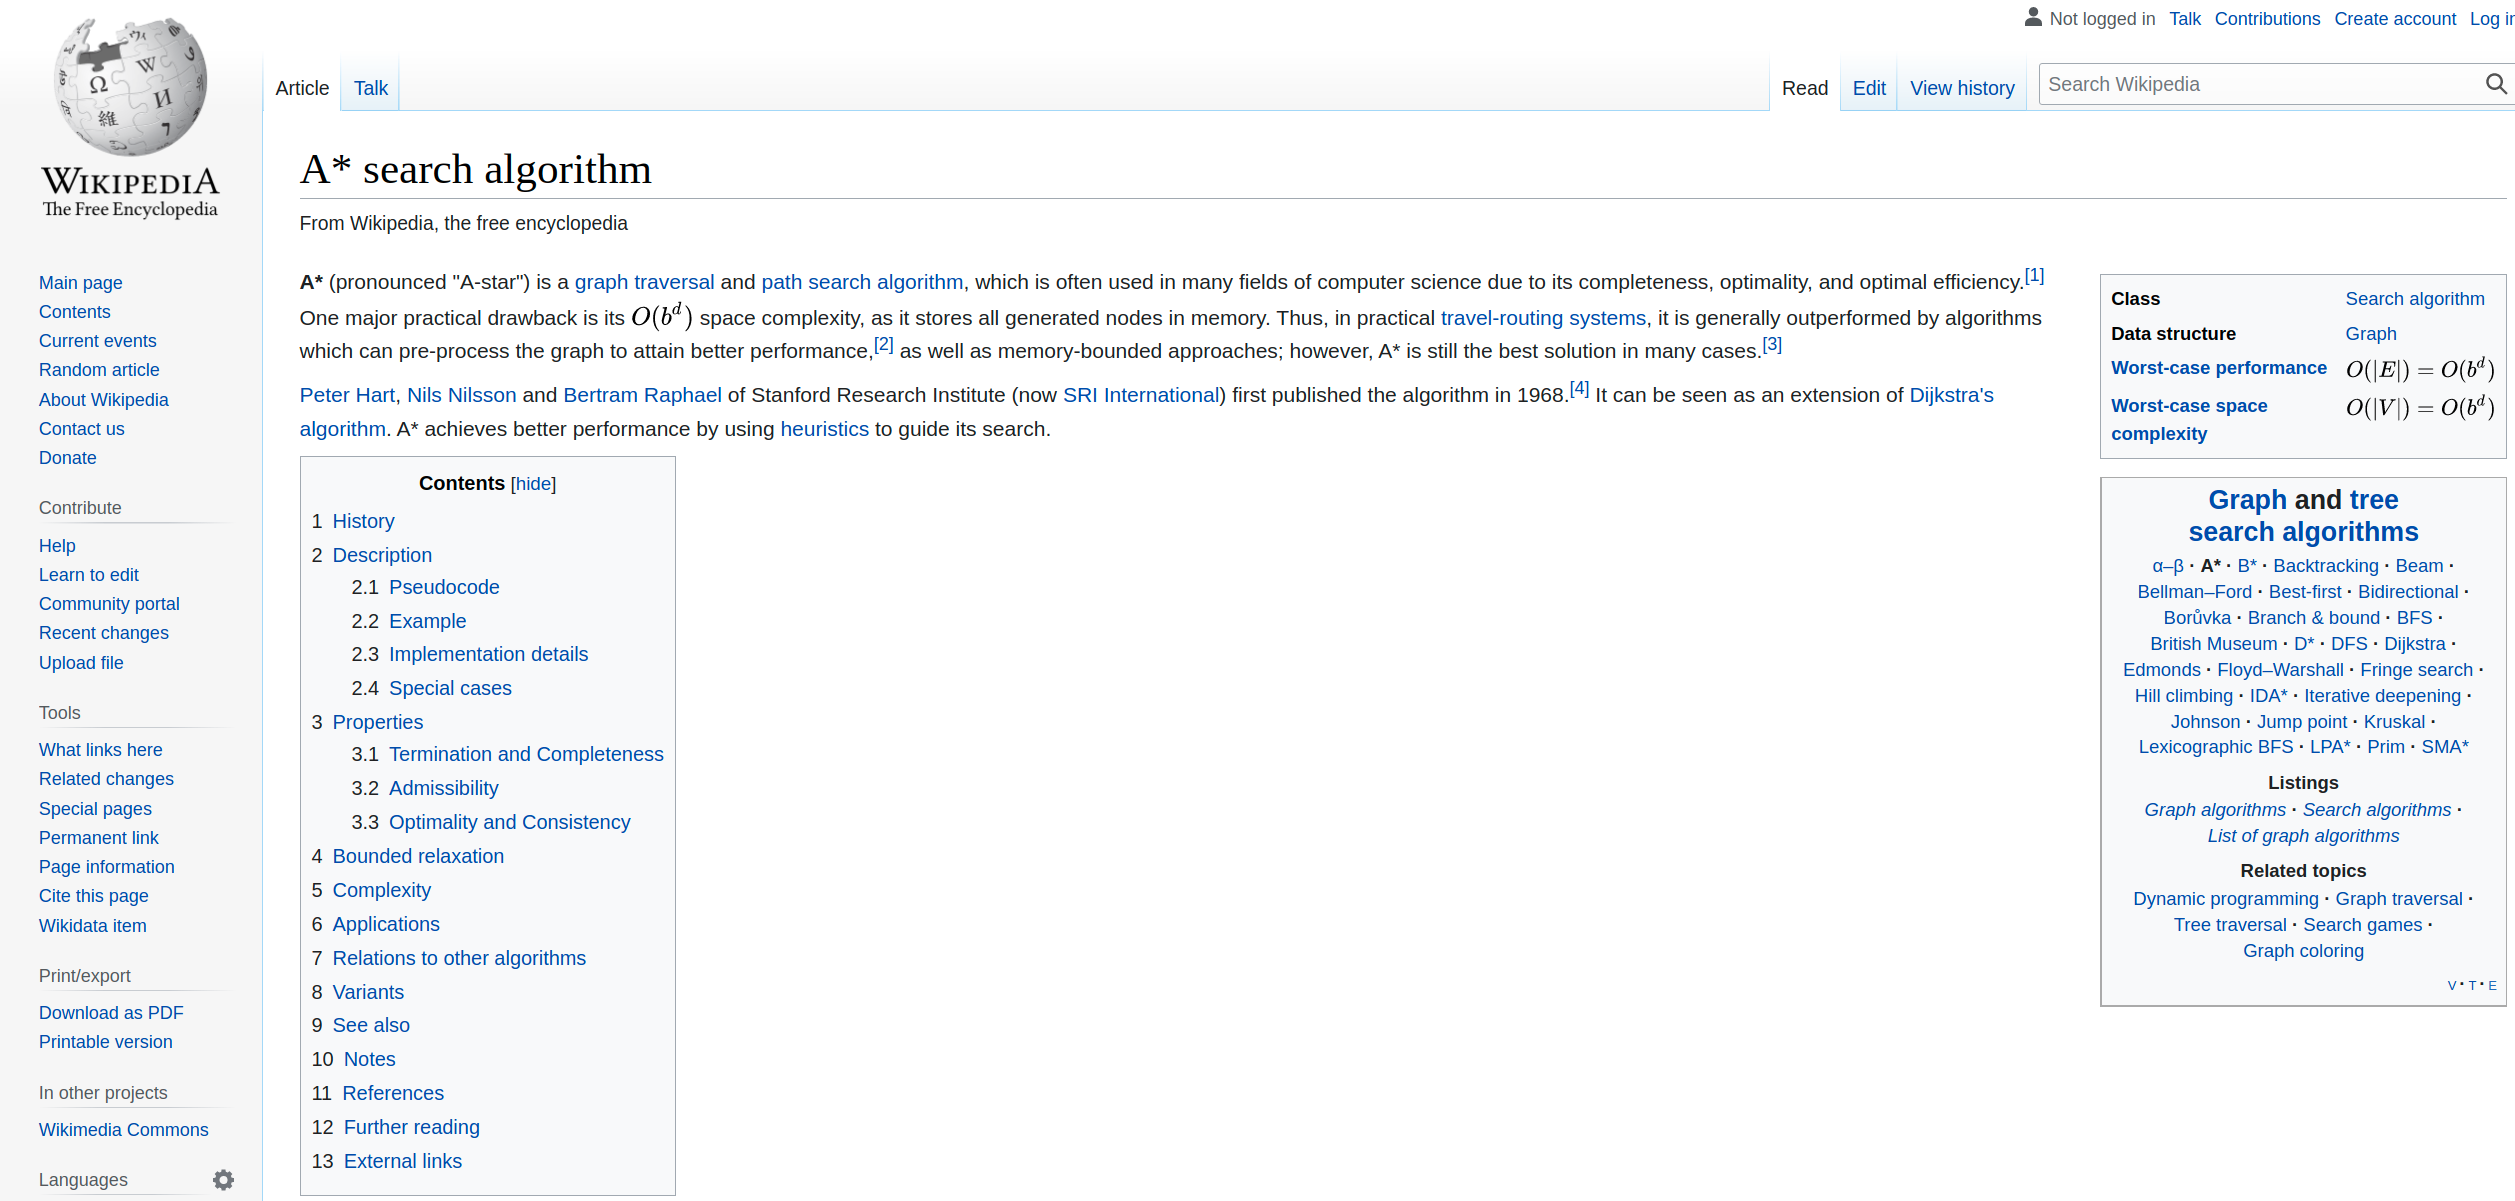
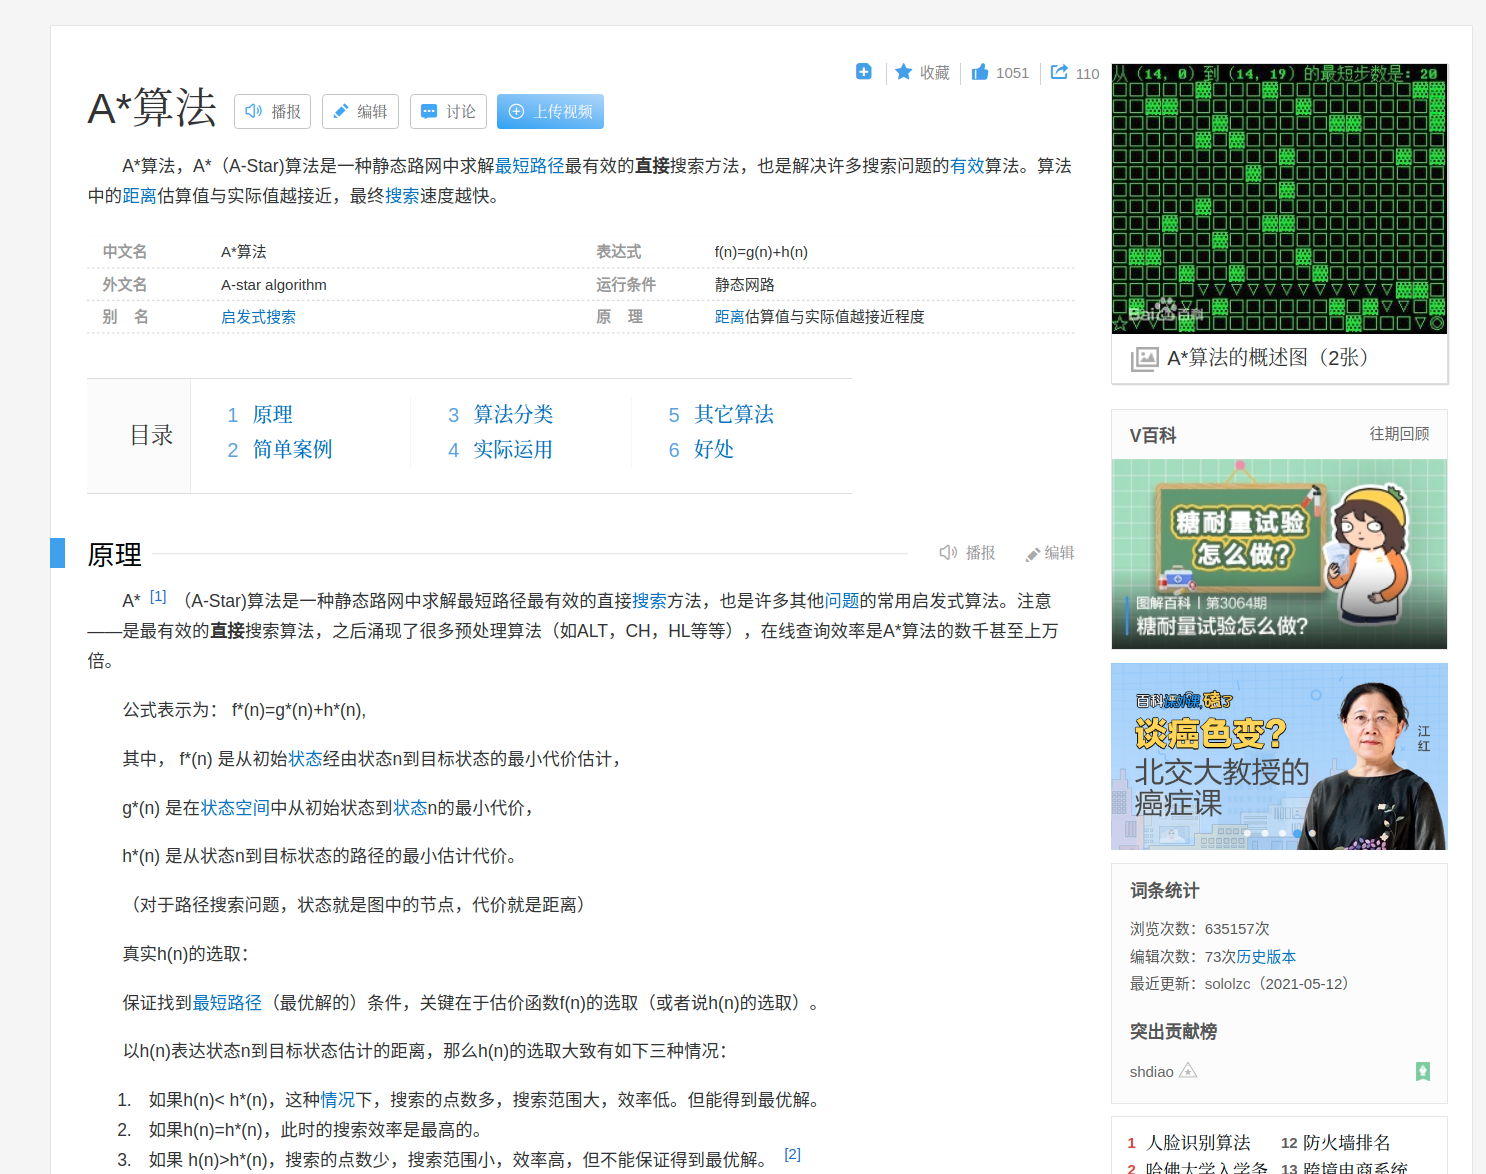
上面是我对于A*算法的理解,如果需要学习A*算法的话,其实B站上、知乎上有很多不错的讲解。这里就贴出来百度百科和维基百科的介绍
From Wikipedia:
A* (pronounced “A-star”) is a graph traversal and path search algorithm, which is often used in many fields of computer science due to its completeness, optimality, and optimal efficiency. One major practical drawback is its O(bdO(b^{d}O(bd) space complexity, as it stores all generated nodes in memory. Thus, in practical travel-routing systems, it is generally outperformed by algorithms which can pre-process the graph to attain better performance, as well as memory-bounded approaches; however, A* is still the best solution in many cases.
From BaiduBaike:
A*算法,A*(A-Star)算法是一种静态路网中求解最短路径最有效的直接搜索方法,也是解决许多搜索问题的有效算法。算法中的距离估算值与实际值越接近,最终搜索速度越快。
2. 实现思路
针对不同的功能,整个程序的实现,主要分为三个层次(软件分层的思想):
- 核心层:负责GUI的显示(地图的绘制与更新)、地图的加载与保存、键盘鼠标等事件对应的回调函数(信号处理函数)的绑定
- 算法实现层:负责A*算法的实现
- 用户界面层:负责提供命令行用户界面,从而实现
高级感(逼格)
1. 核心层
核心层的具体任务为维护全局地图以及进行地图的保存,因此代码也是围绕这两大内容进行编写的。
1. 地图的维护
对于路径规划问题,其核心维护对象就是全局地图地图,因为地图的保存、与加载;GUI的显示以及路径规划的实现都需要地图上区域的状态,因此在核心层首先需要实现的的就是地图。
- 首先是关于地图的表示。对于地图本身而言,由于目前进行的是二维的路径规划,因此可以利用一个二维数组来表示。
- 其次是地图在磁盘上的表示。为了方便保存之后方便读取、加载以及人类的理解,可以将二维数组保存为csv文件从而序列化到磁盘上,而在加载地图的时候再从磁盘上反序列化csv文件到内存,从而读取出来地图。
- 最后是地图中障碍物的表示。由于地图中的区域会有多种状态,例如是否为障碍物(是否可行),其次在进行A*路径规划的时候也会为地图中的区域标记其状态(是否已经考虑过)。因此针对地图中不同的状态的区域,使用不同的数值表示当前区域的状态,例如inf表示障碍物,3表示最终规划得到的路径。
2. 地图的显示
由于地图的显示涉及到图形的显示,因此需要了解一下图形在计算机中的显示。
图形的显示有两种方式,分别是矢量图以及光栅图。
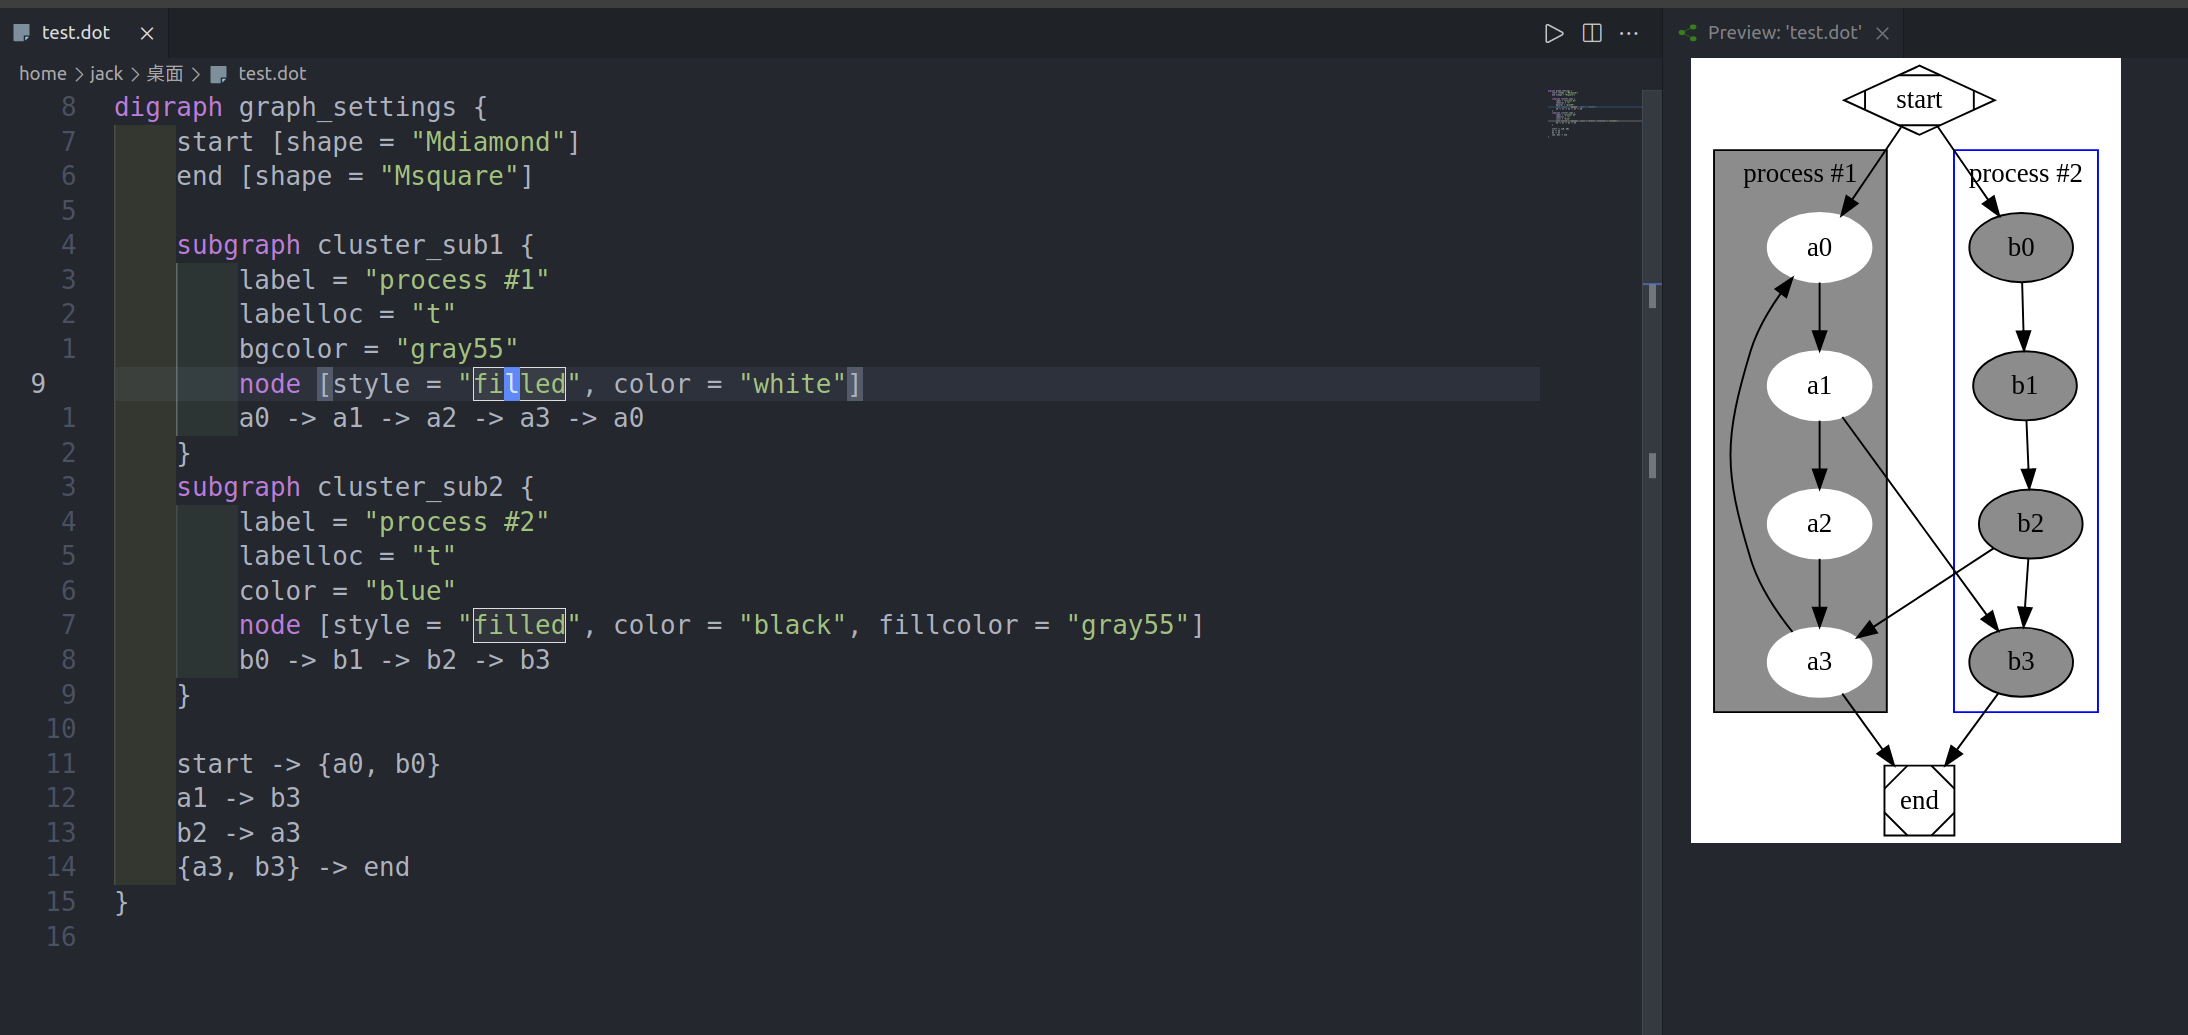
- 对于矢量图,其内部的图形是由基本的几何图形构成的,因此在矢量图文件(例如.dot)文件中,只需要按照指定的格式描述图形的属性即可。例如Windows的.dot文件,我们按照其要求的语法对图形进行描述,然后对应的解析该语法,利用图形学的算法即可渲染出来图形,我们常见的PDF、SVG等等文件都是矢量图。例如下面的例子
- 而对于光栅图,其基本构成单位是像素,每个像素大小只有零点几个毫米,而每平方厘米都会有几百几千个像素。而每个像素都会有自己的数值,表现出来自己的颜色。因此我们通过几万个极小的、在人眼看来是点的像素组合起来就成了我们所看到的图像。因此这种图像又称为位图、点阵图、像素图。我们常见的JPG、PNG、BMP等等都是光栅图,例如下面的例子
[外链图片转存失败,源站可能有防盗链机制,建议将图片保存下来直接上传(img-xSv4Dmap-1669722993662)(https://bkimg.cdn.bcebos.com/pic/54fbb2fb43166d22356091ba4b2309f79052d28d?x-bce-process=image/watermark,image_d2F0ZXIvYmFpa2U4MA==,g_7,xp_5,yp_5/format,f_auto)]
矢量图最大的好处就在于由于其图形是完全利用数学公式描述的(例如圆相对于屏幕左上角的相对距离、圆相对于屏幕宽度的半径等等),因此针对不同的屏幕、不同的放大背书,矢量图片完全可以通过运算进行放大、适配。因此在我们用户看来就是矢量图是无论怎样放大边缘都不会模糊。例如下面的pdf
aas
而光栅图的基本单位是像素,因此再怎么放大,像素都是不会变的,因此在放大一定的倍数就会模糊,这个时候即便有一些算法会做自适应,例如双线性插值、三线性插值等等增加像素的数量,但是他们会造成边缘的模糊
因此在不同场景下有不同的取舍。一般而言,当图形比较好描述(都是规则的几何图形)的时候,就会选择用矢量图,而当图形不好描述的时候(例如自然景观),这个时候就会选择光栅图


尽管地图都是规整的矩形和色块,使用矢量图非常容易描述,但是考虑到如果需要使用矢量图像的话还需要不少的学习成本来学习矢量图的描述语言,花费的时间比较多。而有考虑到Python中其实已经想Matplotlib、Seaborn、Plotly这类非常好的光栅图绘图库(当然他们可以绘制矢量图),因此最终决定使用光栅图来显示、绘制地图。
当然,其实Matplotlib、Plotly这些库最终调用的都是类似于cairo、gtk这些由C/C++开发出来的图形库
3. 地图动态显示
地图的绘制与显示实际上是一个非常消耗资源的操作。上面的GIF和后面放出来的B站的演示视频里A*算法花了不少的时间最后才找到最终的路径,但是真正的纯A*算法的规划路径的速度才只有0.2秒左右,这还是我在100*100的地图上测试的。然而为了显示出A*的动态效果图,因此算法的每次试探都会进行地图的绘制。而每次绘图就需要占去0.2秒左右的时间(我读取系统时间做了benchmark)。因此只敢显示30*30的地图。
因此为了尽可能的的加快绘图的速度,在图形中对所有的Patch(即一个小方格)进行记录,每次只会重新绘制发生了变化的Patch而不会重新绘制整张地图,因此极大地加快了显示的速度。至少在我测试的50*50的场景下效果还是非常不错的。
2. 算法实现层
算法实现层负责实现A*算法。A*算法中使用使用OpenList以及CloseList维护已探索区域和边缘区域。此外为实现算法实现层与核心层解耦合,而二维地图的状 态的维护由核心层提供,因此在算法实现层只需要调用核心层提供的接口进行地图状态修改即可
3. 用户界面层
用户界面层负责GUI的显示以及命令行用户界面。GUI部分通过Matplotlib内嵌的信号与槽机制实现用户鼠标、键盘事件的监听以及回调函数的绑定,进而响应用户事件,完成功能,例如:保存地图 。命令行用户界面负责根绝接收到不同的用户参数,运行不同的功能,例如绘制地图、开始路径规划……
3. 具体代码
1. 导入库
导入Python中队列维护的库queue、路径处理库pathlib、二维数组维护库Numpy、csv序列化与反序列化Pandas库、绘图库Matplotlib以及命令行彩色字体库colorama
import time
import queue
import pprint
import argparse
from typing import *
from pathlib import Path
from collections import namedtupleimport numpy as np
import pandas as pd
import matplotlib.pyplot as plt
import matplotlib.backend_bases as bbasefrom colorama import Fore, Style
2. 核心对象
_MapBase中维护的核心对象为map,程序所处的状态由一个有限状态机维护,不同的事件由不同的回调函数负责处理。
首先,__del__、new、update、add_patch实现了GUI图形的绘制以及更新
pandasfy与depandasfy负责将二维地图以csv文件格式保存至磁盘上
_btn_press_cb、_btn_release_cb、_move_cb、_keyboard_cb分别响应鼠标按下、松开、移动以及键盘按下事件
class _MapBase(object):"""Notes:MapBase 用于可视化的地图创建Args:mapsize (tuple[int, int]): size of mapfigsize (tuple[int, int]): size of figure"""def __init__(self, mapsize: Tuple[int, int], figsize: Tuple[int, int] = (12, 12)):super(_MapBase, self).__init__()# meta informationself._mapsize: Tuple[int, int] = mapsizeself._figsize: Tuple[int, int] = figsize# map, inf obstacle, 0 accessible, 1 in pathself.map: np.ndarray = np.zeros(shape=mapsize)self.map_temp: np.ndarray = None# visualize core objectself._figure, self._axes = plt.subplots(figsize=figsize)self._canvas = self._figure.canvasself._title: plt.Text = Noneself._go_on: bool = False# gui interaction, finite state machine to control plotself._on_press: bool = Falseself._current_state = "add_obstacle"self.btn_pressed_cid = self._canvas.mpl_connect("button_press_event", self._btn_press_cb)self.btn_released_cid = self._canvas.mpl_connect("button_release_event", self._btn_release_cb)self.mouse_move_cid = self._canvas.mpl_connect("motion_notify_event", self._move_cb)self.keyboard_cid = self._canvas.mpl_connect("key_press_event", self._keyboard_cb)self.new()def __del__(self):plt.close(self._figure)def start(self):assert False, f"This method should be overwritten by subclass"def update(self):self._canvas.draw_idle()def new(self) -> bool:"""Notes:new is used to clear the map. In practice, generate a new axesReturns:if_clear (bool): true if successfully clear the map"""try:self.map = np.zeros(shape=self._mapsize)self._axes.cla()self._axes.grid(True)self._axes.set_xticks(range(0, self._mapsize[0] + 1))self._axes.set_yticks(range(0, self._mapsize[1] + 1))self._axes.set_xlim(0, self._mapsize[0])self._axes.set_ylim(0, self._mapsize[1])self._title = self._axes.set_title(f"Current State: {self._current_state}")self._axes.scatter([], [], marker="s", c="red", label="goal")self._axes.scatter([], [], marker="s", c="black", label="obstacle")self._axes.scatter([], [], marker="s", c="green", label="start")self._axes.scatter([], [], marker="s", c="blue", label="final path")self._axes.scatter([], [], marker="s", c="gray", label="explored")self._axes.scatter([], [], marker="s", c="cyan", label="frontier")self._axes.legend(loc=(1.01, 0.85))self.update()return Trueexcept KeyboardInterrupt as e:print("Keyboard interrupted")return Falsedef add_patch(self, x: Union[int, np.ndarray, list], y: Union[int, np.ndarray, list],patches: Union[str, None] = None) -> bool:prompt = (x, y) if isinstance(x, int) else list(zip(x, y))if self._current_state == "add_obstacle":try:self.map[x, y] = np.infexcept IndexError:passself._axes.scatter(x + 0.5, y + 0.5, s=200, marker="s", c="black")print(f"Add obstacle: {prompt}")elif self._current_state == "add_goal":if (self.map == -1).any():print(f"{Fore.YELLOW}Already have one goal!{Style.RESET_ALL}")return Falseself.map[x, y] = -1self._axes.scatter(x + 0.5, y + 0.5, s=200, marker="s", c="red")print(f"Add goal: {prompt}")elif self._current_state == "add_start":if (self.map == -2).any():print(f"{Fore.YELLOW}Already have one start!{Style.RESET_ALL}")return Falseself.map[x, y] = -2self._axes.scatter(x + 0.5, y + 0.5, s=200, marker="s", c="green")print(f"Add start: {prompt}")elif self._current_state == "going_back":self.map[x, y] = -3self._axes.scatter(x + 0.5, y + 0.5, s=200, marker="s", c="blue")elif self._current_state == "clear_patch":if self.map[x, y] == 0:print(f"{Fore.YELLOW}Not in use!{Style.RESET_ALL}")return Falseself.map[x, y] = 0self._axes.scatter(x + 0.5, y + 0.5, s=250, marker="s", c="white")print(f"Cleared: {prompt}")elif self._current_state == "searching":if patches == "explored":# assert (0 <= self.map[x, y] <= 2).all(), f"{Fore.RED}Illegal Operation on map{Fore.RESET}"# self.map[x, y] = 1self._axes.scatter(x + 0.5, y + 0.5, s=200, marker="s", c="gray", alpha=1)elif patches == "frontier":# assert (0 <= self.map[x, y] <= 2).all(), f"{Fore.RED}Illegal Operation on map{Fore.RESET}"# self.map[x, y] = 2self._axes.scatter(x + 0.5, y + 0.5, s=200, marker="s", c="cyan", alpha=1)else:assert False, F"{Fore.RED}Invalid State: {self._current_state}"self.update()return Truedef pandasfy(self) -> pd.DataFrame:"""Notes:pandasfy will serialize current map from matplotlib to cvs fileReturns:serialized_map (pd.Dataframe)"""pp: pd.DataFrame = pd.DataFrame(self.map.copy().T[::-1, :], dtype=str)pp.replace("-1.0", "GOAL", inplace=True)pp.replace("-2.0", "START", inplace=True)return ppdef depandasfy(self, csv_path: Path):"""Notes:depandasfy will deserialized csv file map to matplotlibArgs:csv_path (Path): path of csv fileReturns:None"""df: pd.DataFrame = pd.read_csv(filepath_or_buffer=csv_path, index_col=0, header=0)df.replace("START", "-2.0", inplace=True)df.replace("GOAL", "-1.0", inplace=True)self.new()t = df.to_numpy(dtype=np.float64)[::-1, :].T# self.map = df.to_numpy()xs, ys = np.where(t == np.inf)self._current_state = "add_obstacle"self.add_patch(xs, ys)xs, ys = np.where(t == -1)self._current_state = "add_goal"self.add_patch(xs, ys)xs, ys = np.where(t == -2)self._current_state = "add_start"self.add_patch(xs, ys)def _update_title(self, s: str = None):if s is None:self._title.set_text(f"Current State: {self._current_state}")else:self._title.set_text(s)self.update()def _btn_press_cb(self, event: bbase.MouseEvent) -> None:self._on_press = Trueif event.inaxes:point = (int(event.xdata), int(event.ydata))self.add_patch(*point)def _btn_release_cb(self, event: bbase.MouseEvent) -> None:self._on_press = Falsedef _move_cb(self, event: bbase.MouseEvent) -> None:if self._on_press:if event.inaxes:point = (int(event.xdata), int(event.ydata))self.add_patch(*point)def _keyboard_cb(self, event: bbase.KeyEvent):if event.key == "c":self._current_state = "add_obstacle"print(f"{Fore.YELLOW}Clear all!{Style.RESET_ALL}")self.new()elif event.key == "1":self._current_state = "add_obstacle"print(f"{Fore.GREEN}Switch to {self._current_state}{Style.RESET_ALL}")elif event.key == "2":self._current_state = "add_goal"print(f"{Fore.GREEN}Switch to {self._current_state}{Style.RESET_ALL}")elif event.key == "3":self._current_state = "add_start"print(f"{Fore.GREEN}Switch to {self._current_state}{Style.RESET_ALL}")elif event.key == "0" or event.key == "d":self._current_state = "clear_patch"print(f"{Fore.GREEN}Switch to {self._current_state}{Style.RESET_ALL}")elif event.key == "r":p = self._current_stateself._current_state = "add_obstacle"xs = np.random.randint(0, self._mapsize[0], size=(n := self._mapsize[0] * self._mapsize[1] // 5))ys = np.random.randint(0, self._mapsize[1], size=n)self.add_patch(xs, ys)self._current_state = pelif event.key == "w":files = [i.stem for i in Path(__file__).resolve().absolute().parent.glob("map_*.csv")]if len(files) > 0:name = f"map_{int(max([f.split('_')[1] for f in files])) + 1}"else:name = "map_0"self.pandasfy().to_csv(p := Path(__file__).resolve().parent.joinpath(f"{name}.csv"))print(f"{Fore.GREEN}Save current Map to {p}{Style.RESET_ALL}")elif event.key == "v":print(f"{Fore.GREEN}Start finding goal{self._current_state}{Style.RESET_ALL}")self._go_on = Trueself.start()self._update_title()
3. 算法实现
算法实现由Astar类负责完成,其中由于在计算启发值时可以有多种算法,因此将启发值的计算以静态方法形式嵌入到类中
start方法为完整的A*算法实现,而plot4searching用于在路径规划时动态更新地图
此外OpenList和CloseList分别作为字典的键和值蕴含在came_from和cost_so_far两个字典中,因此不用单独开辟新的数组进行保存
class Astar(_MapBase):def __init__(self, load_path: Union[Path, None], mapsize: Tuple[int, int] = (30, 30)):super(Astar, self).__init__(mapsize=mapsize)if load_path is not None:print(f"{Fore.GREEN}Load from {load_path}{Style.RESET_ALL}")self.depandasfy(load_path)self.update()t = np.where(self.map == -2), np.where(self.map == -1)self.start_point: str = f"{t[0][0][0]},{t[0][1][0]}"self.goal_point: str = f"{t[1][0][0]},{t[1][1][0]}"# open list, but I think frontier is a better name# no need for close list for which has been represented as items of came_from or keys of cost_so_farself.frontier = queue.PriorityQueue()self.frontier.put((0, self.start_point))self.came_from: Dict[str, Union[str, None]] = {self.start_point: None}self.cost_so_far: Dict[str, float] = {self.start_point: 0}self._last: np.ndarray = Noneplt.show()else:print(f"{Fore.GREEN}Start drawing map{Style.RESET_ALL}")plt.show()def start(self):"""Notes:A* algorithm implementationReturns:None"""if_can_find_goal: bool = False# get the closest pointself._current_state = "searching"self._update_title()while not self.frontier.empty():current_p: str = self.frontier.get()[1]# find the goalif current_p == self.goal_point:if_can_find_goal = Truebreaknext_p: strfor next_p in (n := self._get_neighbor(current_p)):new_cost = self.cost_so_far[current_p] + self._get_cost(next_p, current_p)# if next point has not been considered / next point in in undiscovered area# or there exists a nearer way to get to next point by passing current point# this also can help preventing going backif next_p not in self.cost_so_far.keys() or new_cost < self.cost_so_far[next_p]:self.cost_so_far[next_p] = new_costpriority = new_cost + self._get_cost(next_p, self.goal_point)self.frontier.put((priority, next_p))current_pp = [int(i) for i in current_p.split(",")]self.came_from[next_p] = f"{current_pp[0]},{current_pp[1]}"self._plot4searching()plt.pause(0.0001)self.update()if not if_can_find_goal:print(f"{Fore.RED}Cannot find the goal in current map{Style.RESET_ALL}")self._update_title("STOP: cannot find the path!")returnelse:# go back to find the pathself._current_state = "add_goal"goal = (int(i) for i in self.goal_point.split(","))self.add_patch(*goal)self._current_state = "going_back"self._update_title()path = []current_p = self.goal_pointwhile current_p != self.start_point:current_p = self.came_from[current_p]p = tuple(int(i) for i in current_p.split(","))path.append(p)self.add_patch(*p)self._current_state = "add_start"start = (int(i) for i in self.start_point.split(","))self.add_patch(*start)print(f"{Fore.BLUE}{Style.BRIGHT}Success!{Style.RESET_ALL}")print("Path:")pprint.pprint(path)return pathdef _get_neighbor(self, point: str):from itertools import productx, y = [int(i) for i in point.split(",")]neighbor = []for i, j in product([-1, 0, 1], [-1, 0, 1]):if abs(i) + abs(j) == 0:continueif 0 <= (dx := x + i) <= self._mapsize[0] and 0 <= (dy := y + j) <= self._mapsize[1] and \self.map[dx, dy] != np.inf:neighbor.append(f"{dx},{dy}")return neighbordef _get_cost(self, point1: str, point2: str):# x, y = [int(i) for i in point.split(",")]# return self.manhattan_distance(*[int(i) for i in point1.split(",")],# *[int(i) for i in point2.split(",")])return self.euler_distance(*[int(i) for i in point1.split(",")],*[int(i) for i in point2.split(",")])def _plot4searching(self):"""Codes for plotting"""# update current map# explore areaexplored_ps = ([], [])for p, parent in self.came_from.items():pp = [int(i) for i in p.split(",")]if parent is not None:explored_ps[0].append(pp[0])explored_ps[1].append(pp[1])self.map[np.array(explored_ps[0]), np.array((explored_ps[1]))] = 1# frontierfrontier_ps = ([], [])t = []while not self.frontier.empty():t.append(self.frontier.get())for i in t:self.frontier.put(i)for tt in t:# frontier_ps.append(t.get()[1])p = [int(i) for i in tt[1].split(",")]frontier_ps[0].append(p[0])frontier_ps[1].append(p[1])# simply deepcopy locked object will raise an error# t = copy.deepcopy(self.frontier)self.map[np.array(frontier_ps[0]), np.array(frontier_ps[1])] = 2# find differenceif self._last is None:update_explored = list(zip(*np.where(self.map == 1)))update_frontier = list(zip(*np.where(self.map == 2)))# update_frontier = [(i,j) for i, j in zip(*update_frontier)]else:last_explored = list(zip(*np.where(self._last == 1)))last_frontier = list(zip(*np.where(self._last == 2)))current_explored = list(zip(*np.where(self.map == 1)))current_frontier = list(zip(*np.where(self.map == 2)))update_explored = list(set(current_explored) - set(last_explored))update_frontier = list(set(current_frontier) - set(last_frontier))self._last = self.map.copy()# draw explored areaif len(update_explored) > 0:self.add_patch(np.array([i[0] for i in update_explored]), np.array([i[1] for i in update_explored]),patches="explored")# draw frontierif len(update_frontier) > 0:self.add_patch(np.array([i[0] for i in update_frontier]), np.array([i[1] for i in update_frontier]),patches="frontier")@staticmethoddef manhattan_distance(x1, y1, x2, y2):return abs(x2 - x1) + abs(y2 - y1)@staticmethoddef euler_distance(x1, y1, x2, y2):if (d := abs(x2 - x1) + abs(y2 - y1)) == 1:return 1elif d == 2:return 1.4else:return round(np.sqrt((x2 - x1) ** 2 + (y2 - y1) ** 2), ndigits=2)
4. 命令行参数解析
命令行参数解析由parse_arg函数负责完成,并返回Namespace对象
def parse_arg():parer = argparse.ArgumentParser(description=f"{Fore.GREEN}{Style.BRIGHT}A* Algorithm, animated with matplotlib{Style.RESET_ALL}. "f"Author: {Fore.YELLOW}Jack Wang{Fore.RESET}. "f"Date: {Fore.YELLOW}2021-12-15{Style.RESET_ALL}.""This script provides A* algorithm illustration with the help of matplotlib\n"f"You can use this script either by {Fore.GREEN}command-line interface{Fore.RESET} "f"or {Fore.GREEN}python code interface{Fore.RESET}.""To use this script with command-line interface, call this script with -h option. ""To use this script in python code, ""simply calling Astar class to create an Astar object, then everything will be done. ""If load_path argument of Astar class are not specified (i.e. load_path=None), ""this program will create a blank""map for you, else loading an existing map.""\n\n""In the matplotlib GUI, press 1 to add obstacle, 2 to add goal, 3 to add start, w to save map, ""r to random generate obstacles, d to delete an grid and v to start path planning. "f"{Fore.YELLOW}Note: when call with -c, you can not press v to start path planning, -c is only "f"for drawing map. {Style.RESET_ALL}")parer.add_argument("-o", dest="ok", action="store_true", help="must be added when calling the scripts to let me ""know you understand how to use this program")parer.add_argument("-c", dest="gen_map", action="store_true", help="create a new map")parer.add_argument("-l", dest="load_num", type=int, default=-1, help="load a existing map")return parer.parse_args()
5. 主程序
主程序中若不提供加载的地图路径则默认打开新的地图用于地图绘制
def main():args = parse_arg()if not args.ok:print(f"{Fore.RED}Please read the help info with -h option the rerun the scripts with -o option{Fore.RESET}")returnif args.gen_map:Astar(load_path=None)returnif args.load_num != -1:Astar(load_path=Path(__file__).resolve().parent.joinpath(f"map_{args.load_num}.csv"))if __name__ == "__main__":# a = Astar(load_path=Path("./map_4.csv"))# a = Astar(load_path=Path(__file__).resolve().parent.joinpath("./map_1.csv"))main()

![[附源码]计算机毕业设计SpringBoot高血压分析平台](https://img-blog.csdnimg.cn/68acb97b44644a61a0dbd98d5e40ecb4.png)


![[附源码]SSM计算机毕业设计校园疫情防控管理系统JAVA](https://img-blog.csdnimg.cn/0580695c0edf47d893c8791c8f495f28.png)